Chapter IX RESIDUAL NUCLEAR RADIATION AND FALLOUT
SOURCES OF RESIDUAL RADIATION
INTRODUCTION
9.01 The residual nuclear radiation is defined as that which is emitted later than 1 minute from the instant of the explosion (§ 8.02). The sources and characteristics of this radiation will vary in accordance with the relative extents to which fission and fusion reactions contribute to the energy of the weapon. The residual radiation from a fission weapon detonated in the air arises mainly from the weapon debris, that is, from the fission products and, to a lesser extent, from the uranium and plutonium which have escaped fission. In addition, the debris will usually contain some radioactive isotopes formed by neutron reactions, other than fission, in the weapon materials. Another source of residual radiation, especially for surface and subsurface bursts, is the radioactivity induced by the interaction of neutrons with various elements present in the earth, sea, air, or other substances in the explosion environment. The debris from a predominantly fusion weapon, on the other hand, will not contain the quantities of fission products associated with a fission weapon of the same energy yield. However, large numbers of high-energy neutrons are produced (§ 1.72), so that the residual radiation from fusion weapons will arise mainly from neutron reactions in the weapon and its surroundings, if the fission yield is sufficiently low.
9.02 The primary hazard of the residual radiation results from the creation of fallout particles (§ 2.18 et seq.) which incorporate the radioactive weapon residues and the induced activity in the soil, water, and other materials in the vicinity of the explosion. These particles may be dispersed over large areas by the wind and their effects may be felt at distances well beyond the range of the other effects of a nuclear explosion (§ 9.113). A secondary hazard may arise from neutron induced activity on the earth’s surface in the immediate neighborhood of the burst point (§ 8.16). Both the absolute and relative contributions of the fission product and induced radioactivity will depend on the total and fission yields of the weapon, the height of burst, the nature of the surface at the burst point, and the time after the explosion.
9.03 As mentioned in § 2.28, it is convenient to consider the fallout in two parts, namely, early and delayed. Early (or local) fallout is defined as that which reaches the ground during the first 24 hours following a nuclear explosion. The early fallout from surface, subsurface, or low air bursts can produce radioactive contamination over large areas and can represent an immediate biological hazard. Delayed (or long range) fallout, which is that reaching the ground after the first day, consists of very fine, invisible particles which settle in low concentrations over a considerable portion of the earth’s surface. The radiation from the fission products and other substances is greatly reduced as a result of radioactive decay during the relatively long time the delayed fallout remains suspended in the atmosphere. Consequently, the radiations from most of the delayed fallout pose no immediate danger to health, although there may be a long-term hazard. The biological effects on people, plants, and animals of the radiations from early and late fallout are described in Chapter XII.
9.04 In the case of an air burst, particularly when the fireball is well above the earth’s surface, a fairly sharp distinction can be made between the initial nuclear radiation, considered in the preceding chapter, and the residual radiation. The reason is that, by the end of a minute, essentially all of the weapon residues, in the form of very small particles, will have risen to such a height that the nuclear radiations no longer reach the ground in significant amounts. Subsequently, the fine particles are widely dispersed in the atmosphere and descend to earth very slowly.
9.05 With surface and, especially, subsurface explosions, or low air bursts in weather involving precipitation (§ 9.67) the demarcation between initial and residual nuclear radiations is not as definite. Some of the radiations from the weapon residues will be within range of the earth’s surface at all times, so that the initial and residual categories merge continuously into one another (§§ 2.82, 2.100). For very deep underground and underwater bursts the initial gamma rays and neutrons produced in the fission or fusion process may be ignored since they are absorbed by the surrounding medium. The residual radiations, from fission products and from radioactive species produced by neutron interaction, are then the only kind of nuclear radiations that need be considered. In a surface burst, however, both initial and residual nuclear radiations must be taken into account.
EARLY FALLOUT
9.06 The radiological characteristics of the early fallout from a nuclear weapon are those of the fission products and any induced activity produced. The relative importance of these two sources of residual radiation depends upon the percentage of the total yield that is due to fission, and other factors mentioned in § 9.02. There are, however, two additional factors, namely, fractionation and salting, which may affect the activity of the early fallout; these will be described below.
9.07 As the fireball cools, the fission products and other vapors are gradually condensed on such soil and other particles as are sucked up from below while the fireball rises in the air. For detonations over land, where the particles consist mainly of soil minerals, the fission product vapors condense onto both solid and molten soil particles and also onto other particles that may be present. In addition, the vapors of the fission products may condense with vapors of other substances to form mixed solid particles of small size. In the course of these processes, the composition of the fission products will change, apart from the direct effects of radioactive decay. This change in composition is called “fractionation.” The occurrence of fractionation is shown, for example, by the fact that in a land surface burst the larger particles, which fall out of the fireball at early times and are found near ground zero, have different radiological properties from the smaller particles that leave the radioactive cloud at later times and reach the ground some distance downwind.
9.08 The details of the fractionation process are not completely understood, but models have been developed that represent the phenomena reasonably satisfactory. Fractionation can occur, for example, when there is a change in physical state of the fission products. As a result of radioactive decay, the gases krypton and xenon form rubidium and cesium, respectively, which subsequently condense onto solid particles. Consequently, the first particles to fall out, near ground zero, will be depleted not only in krypton and xenon, but also in their various decay (or daughter) products. On the other hand, small particles that have remained in the cloud for some time will have rubidium and cesium, and their daughters, strontium and barium, condensed upon them. Hence, the more distant fallout will be relatively richer in those elements in which the close fallout is depleted.
9.09 An additional phenomenon which contributes to the fractionation process is the separation of the fission product elements in the ascending fireball and cloud as they condense at different times, corresponding to their different condensation temperatures. Thus the refractory elements can condense at early times in the nuclear cloud, when the temperature is quite high, onto the relatively larger particles which are more abundant at these times. Conversely, volatile elements, with low condensation temperatures, cannot condense until later, when the cloud has cooled and when the larger particle sizes will be depleted. Refractory elements are expected to be relatively more abundant in the close-in early fallout, representing the larger particles, and to be relatively depleted in the more distant portion of the early fallout deposited by smaller particles. The reverse will be true for the more volatile elements. The particle size distribution in the nuclear cloud varies with the surface material and hence the latter will have an effect on fractionation.
9.10 For explosions of large energy yield at or near the surface of the sea, where the condensed particles consist of sea-water salts and water, fractionation is observed to a lesser degree than for a land surface burst. The reason is that the cloud must cool to 100°C (212°F) or less before the evaporated water condenses. The long cooling time and the presence of very small water droplets permit removal from the radioactive cloud of the daughters of the gaseous krypton and xenon along with the other fission products. In this event, there is little or no variation in composition of the radioactive fallout (or rainout) with distance from the explosion.
9.11 The composition of the fallout can also be changed by “salting” the weapon to be detonated. This consists in the inclusion of significant quantities of certain elements, possibly enriched in specific isotopes, for the purpose of producing induced radioactivity. There are several reasons why a weapon might be salted. For example, salting has been used in some weapons tests to provide radioactive tracers for various purposes, such as the study of the paths and relative compositions of the early and delayed stages of fallout.
ACTIVITY AND DECAY OF EARLY FALLOUT
9.12 The fission products constitute a very complex mixture of more than 300 different forms (isotopes) of 36 elements (§ 1.62). Most of these isotopes are radioactive, decaying by the emission of beta particles, frequently accompanied by gamma radiation. About 3 × 10²³ fission product atoms, weighing roughly 2 ounces, are formed per kiloton (or 125 pounds per megaton) of fission energy yield. The total radioactivity of the fission products initially is extremely large but it falls off at a fairly rapid rate as the result of radioactive decay.
9.13 At 1 minute after a nuclear explosion, when the residual nuclear radiation has been postulated as beginning, the radioactivity of the fission products from a 1-kiloton fission yield explosion is of the order of 1021 disintegrations per second, i.e., almost 3 × 10¹⁰ curies (§ 9.141). The level of activity even from an explosion of low yield is enormously greater than anything that had been encountered prior to the detonation of nuclear weapons. By the end of a day, the rate of beta-particle emission will have decreased by a factor of about 2,000 from its 1-minute value, and there will have been an even larger decrease in the gamma-ray energy emission rate. Nevertheless, the radioactivity of the fission products will still be very considerable.
9.14 It has been calculated (§ 9.159) that if fallout particles were spread uniformly over a smooth infinite plane surface, with the radioactivity equal to that of all the fission products from 1-kiloton fission energy yield for each square mile, the radiation dose rate at a height of 3 feet above the plane would be approximately 2,900 rads (in tissue)1 per hour at 1 hour after the explosion.2 In actual practice, a uniform distribution would be improbable, since a larger proportion of the fission products would be deposited near ground zero than at farther distances. Hence, the dose rate will greatly exceed the average at points near the explosion center, whereas at more remote locations it will usually be less. Moreover, the phenomenon of fractionation will cause a depletion of certain fission product isotopes in the local fallout; this will tend to lower the theoretically calculated dose rate. Finally, the actual surface of the earth is not a smooth plane. As will be discussed subsequently (§ 9.95), the surface roughness will cause a further decrease in the dose rate calculated for an infinite smooth plane. In spite of these reductions, extremely high dose rates have been observed within the first few hours following surface bursts.
9.15 The early fallout consists of particles that are contaminated mainly, but not entirely, with fission products. An indication of the manner in which the dose rate from a fixed quantity of the actual mixture decreases with time may be obtained from the following approximate rule: for every sevenfold increase in time after the explosion, the dose rate decreases by a factor of ten. For example, if the radiation dose rate at 1 hour after the explosion is taken as a reference point, then at 7 hours after the explosion the dose rate will have decreased to one-tenth; at 7 × 7 = 49 hours (or roughly 2 days) it will be one-hundredth; and at 7 × 7 x 7 = 343 hours (or roughly 2 weeks) the dose rate will be one-thousandth of that at 1 hour after the burst. Another aspect of the rule is that at the end of 1 week (7 days), the radiation dose rate will be about one tenth of the value after 1 day. This rule is accurate to within about 25 percent up to 2 weeks or so and is applicable to within a factor of two up to roughly 6 months after the nuclear detonation. Subsequently, the dose rate decreases at a much more rapid rate than predicted by this rule. The complications introduced by fractionation and the presence of induced activities make the approximate rule useful only for illustration and some planning purposes. Any change in the quantity of fallout, arising from the continuing descent or the removal of particles or from multiple detonations, would affect the dose rate. Hence, in any real fallout situation, it would be necessary to perform actual measurements repeated at suitable intervals to establish the level and the rate of decay of the radioactivity.
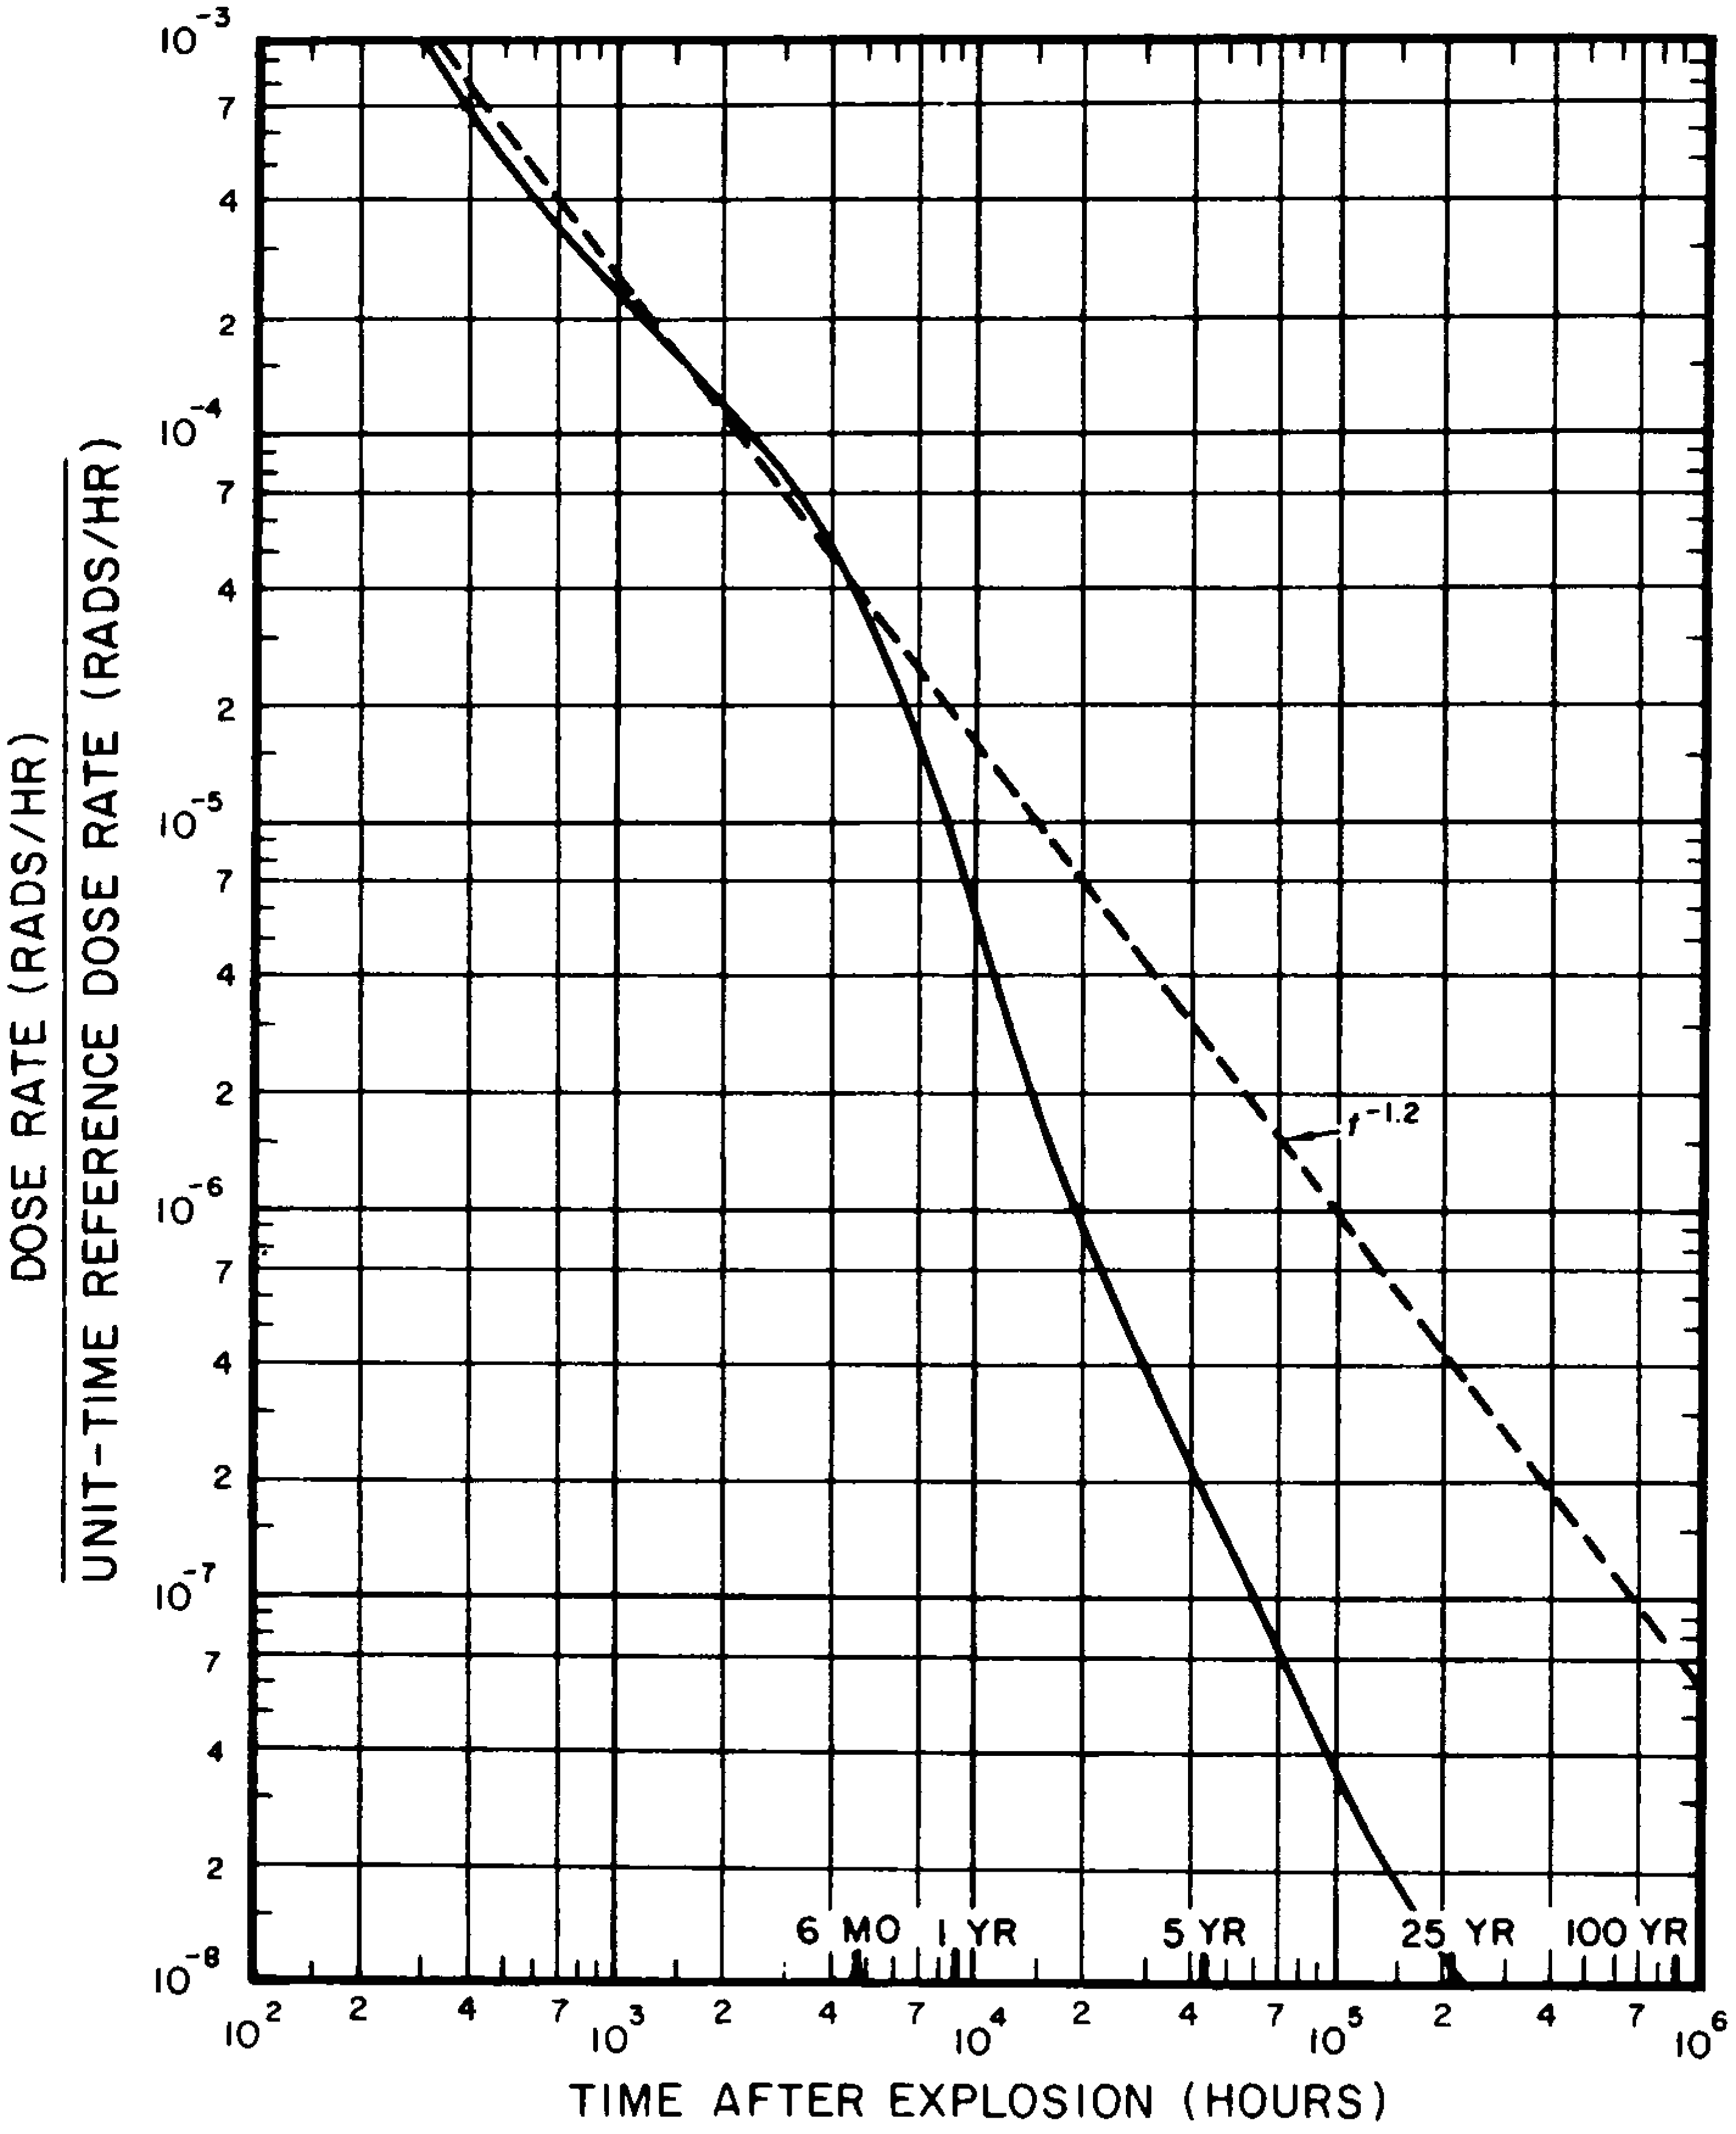
9.16 The decrease of dose rate from a given amount of the early fallout, consisting of fission products and some other weapon residues (§ 9.32), is indicated by the continuous curves in Figs. 9.16a and b, which were calculated in the manner described in § 9.146. In these figures the ratio of the approximate radiation dose rate (in rads per hour) at any time after the explosion to a convenient reference value, called the “unit time reference dose rate,” is plotted against time in hours.3 The use of the reference dose rate simplifies the representation of the results and the calculations based on them, as will be shown below. The following treatment refers only to external radiation exposures from gamma-ray sources outside the body. The possibility should be borne in mind, however, that some fallout could enter the body, by inhalation and ingestion, and so give rise to internal radiation exposures (§ 12.163 et seq.). The major hazard in this respect is probably radioactive iodine, which can readily enter the body by way of milk from cows that have eaten forage contaminated with fallout. Because the internal doses are highly dependent upon the circumstances, they are not predictable.
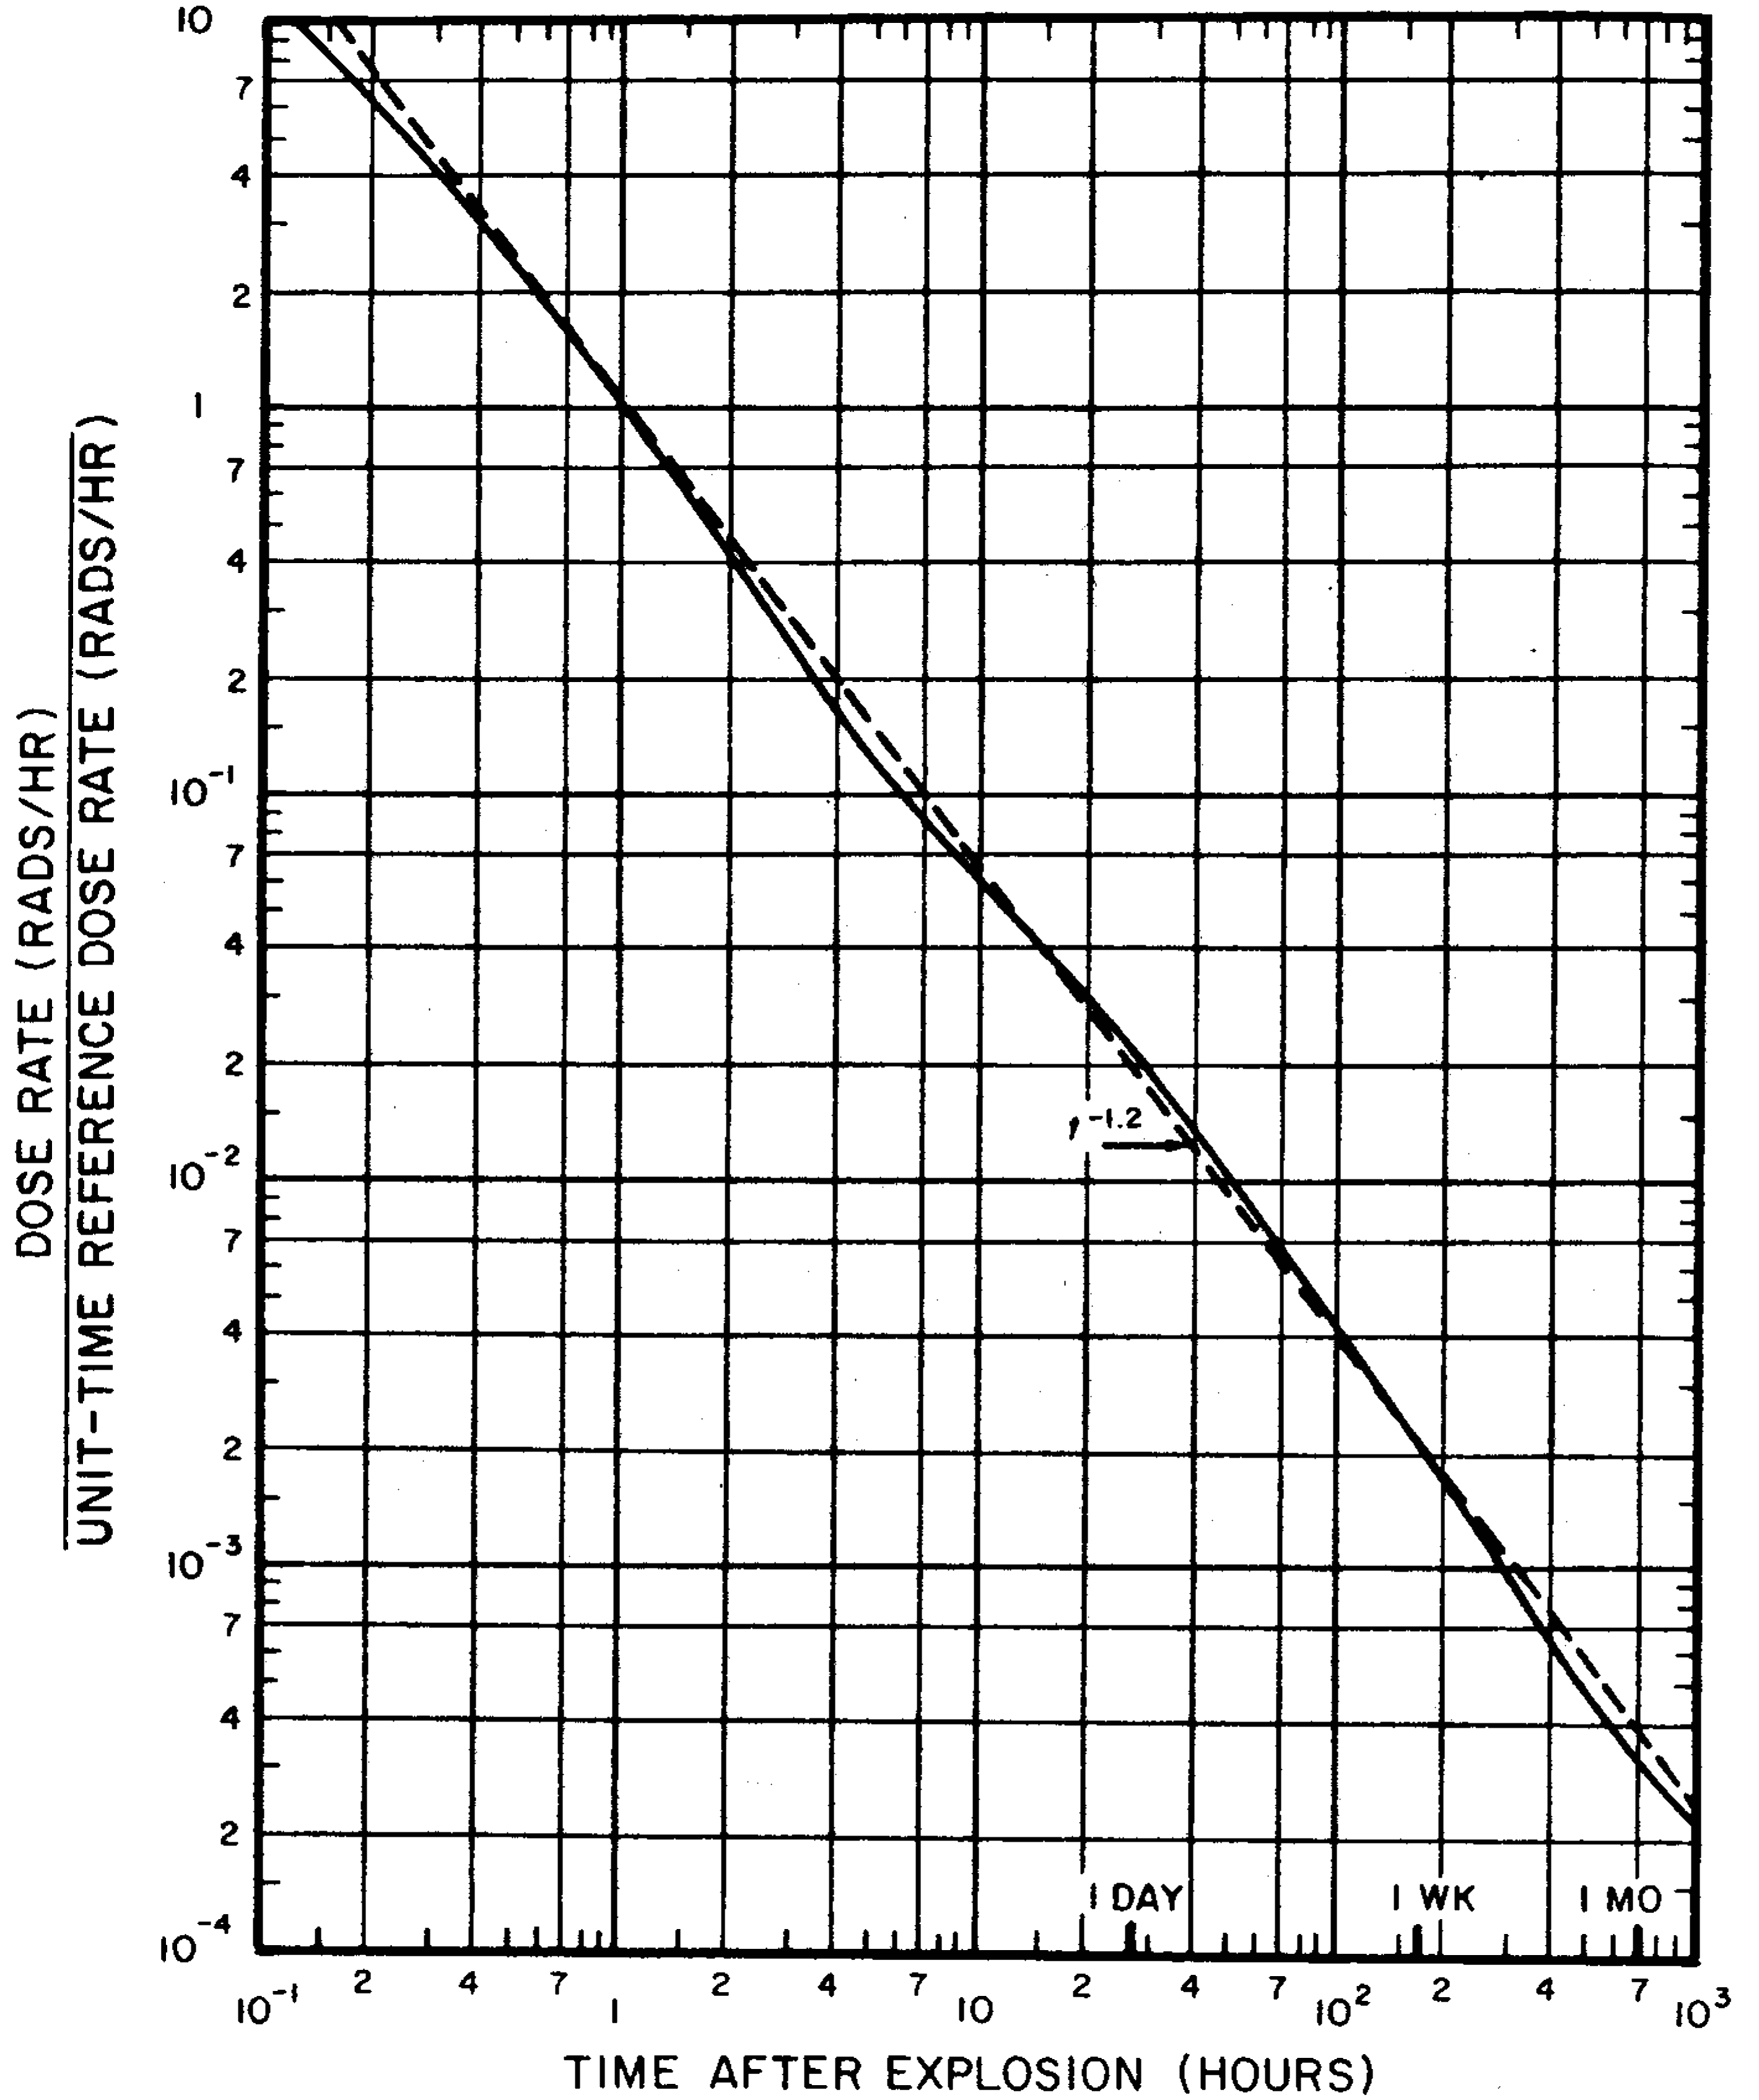
9.17 Suppose, for example, that at a given location, the fallout commences at 5 hours after the explosion, and that at 15 hours, when the fallout has ceased to descend, the observed (external) dose rate is 4.0 rads per hour (rads/hr). From the curve in Fig. 9.16a (or the data in Table 9. 19), it is seen that at 15 hours after the explosion, the ratio of the actual dose rate to the reference value is 0.040; hence, the reference dose rate must be 4.0/0.040= 100 rads/hr. By means of this reference value and the decay curves in Figs. 9. 16a and b, it is possible to estimate the actual dose rate at the place under consideration at any time after fallout is complete. Thus, if the value is required at 24 hours after the explosion, Fig. 9.16a is entered at the point representing 24 hours on the horizontal axis. Upon moving upward vertically until the plotted (continuous) line is reached, it is seen that the required dose rate is 0.023 multiplied by the unit-time reference dose rate, i.e., 0.023 × 100 = 2.3 rads/hr.
9.18 If the dose rate at any time is known, by actual measurement, the value at any other time can be estimated. All that is necessary is to compare the ratios (to the unit-time reference dose rate) for the two given times as obtained from Fig. 9.16a or Fig. 9.16b. For example, suppose the dose rate at 3 hours after the explosion is found to be 50 rads/hr; what would be the value at 18 hours? The respective ratios, as given by the curve in Fig. 9.16a, are 0.23 and 0.033, with respect to the unit-time reference dose rate. Hence, the dose rate at 18 hours after the explosion is 50 × 0.033/0.23 = 7.2 rads/hr.
9.19 The results in Figs. 9. 16a and b may be represented in an alternative form, as in Table 9.19, which is more convenient, although somewhat less complete. The dose rate, in any suitable units, is taken as 1,000 at 1 hour after a nuclear explosion; the expected dose rate in the same units at a number of subsequent times, for the same quantity of early fallout, are then as given in the table. If the actual dose rate at 1 hour (or any other time) after the explosion is known, the value at any specified time, up to 1,000 hours, can be obtained by simple proportion.4
| Time (hours) | Relative dose rate | Time (hours) | Relative dose rate |
|---|---|---|---|
| 1 | 1,000 | 36 | 15 |
| 1½ | 610 | 48 | 10 |
| 2 | 400 | 72 | 6.2 |
| 3 | 230 | 100 | 4.0 |
| 5 | 130 | 200 | 1.7 |
| 6 | 100 | 400 | 0.69 |
| 10 | 63 | 600 | 0.40 |
| 15 | 40 | 800 | 0.31 |
| 24 | 23 | 1,000 | 0.24 |
9.20 It should be noted that Figs. 9. 16a and band Table 9.19 are used for calculations of dose rates. In order to determine the total or accumulated radiation dose received during a given period it is necessary to multiply the average dose rate by the exposure time. However, since the dose rate is steadily decreasing during the exposure, appropriate allowance for this must be made. The results of the calculations based on Fig. 9. 16a are expressed by the curve in Fig. 9.20. It gives the total dose received from early fallout, between 1 minute and any other specified time after the explosion, in terms of the unit-time reference dose rate.
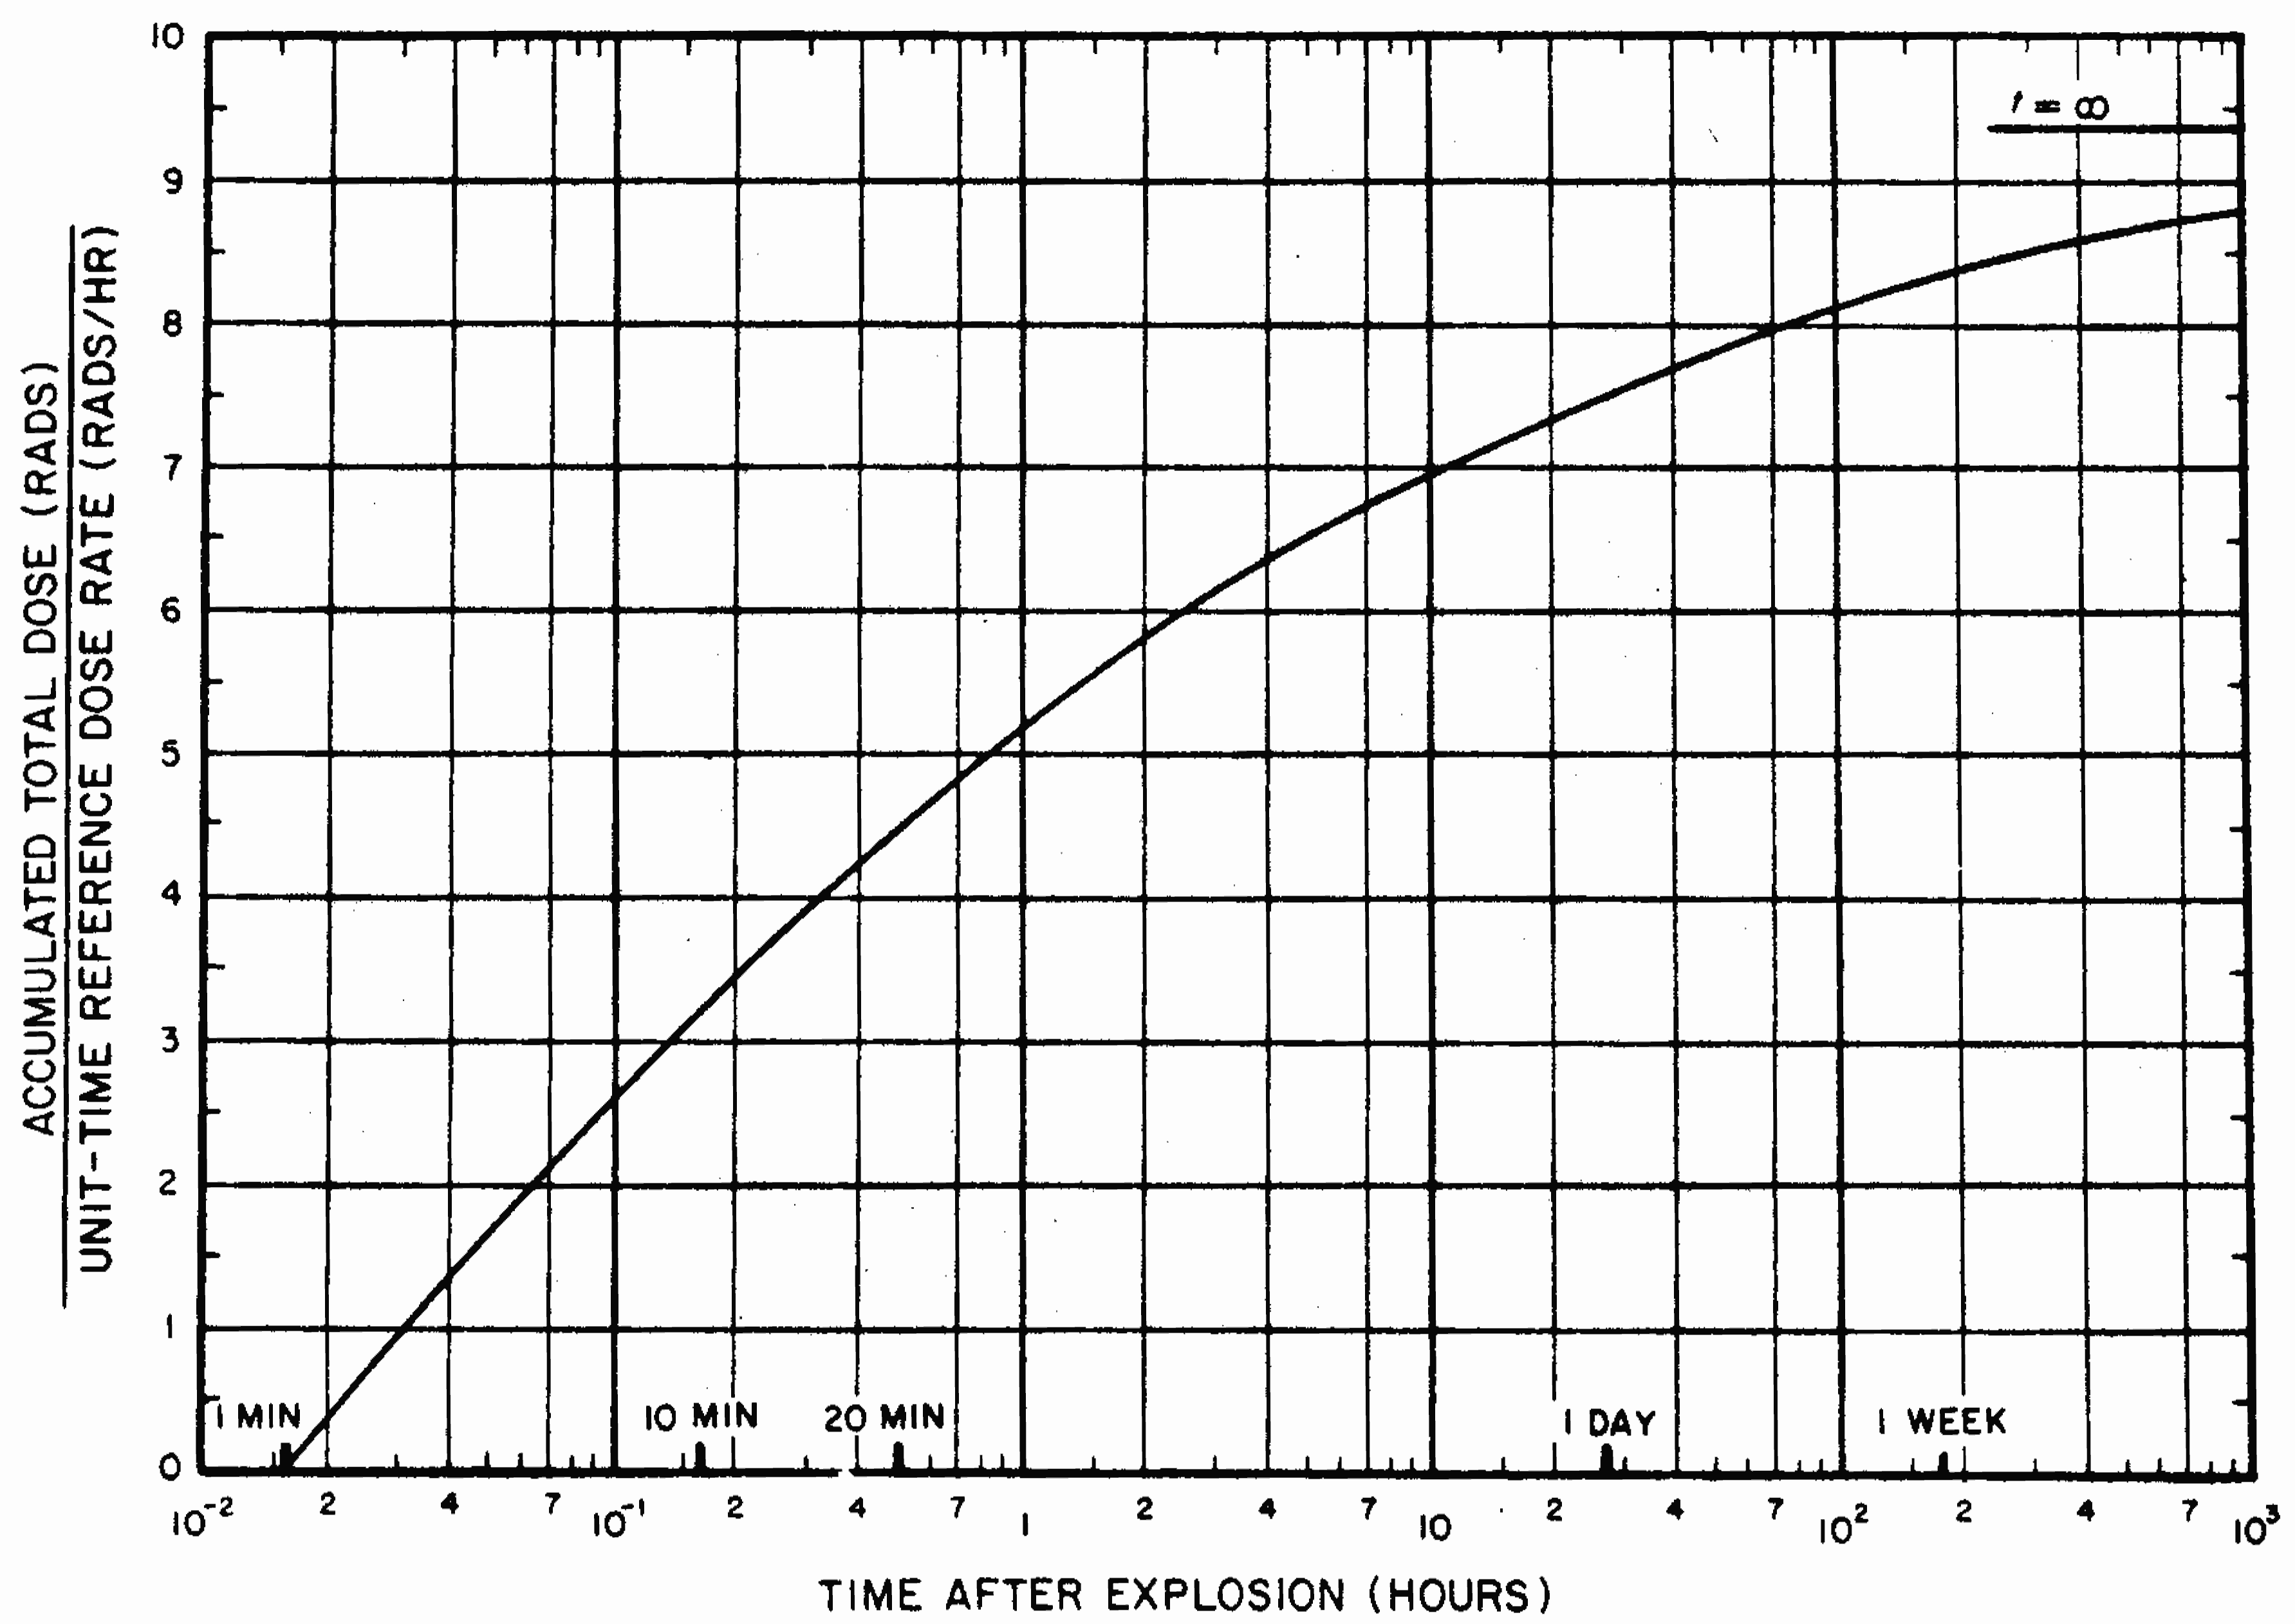
9.21 To illustrate the application of Fig. 9.20, suppose that an individual becomes exposed to a certain quantity of gamma radiation from early fallout 2 hours after a nuclear explosion and the dose rate, measured at that time, is found to be 1.5 rads/hr. What will be the total dose accumulated during the subsequent 12 hours, i.e., by 14 hours after the explosion? The first step is to determine the unit-time reference dose rate. From Fig. 9. 16a it is seen that
\[ \frac{\text{Dose rate at 2 hours after explosion}}{\text{Unit-time reference dose rate}} = 0.40 \]and, since the dose rate at 2 hours is known to be 1.5 rads/hr, the reference value is 1.5/0.40=3.8 rads/hr. Next, from Fig. 9.20, it is found that for 2 hours and 14 hours, respectively, after the explosion,
\[ \frac{\text{Accumulated dose at 2 hours after explosion}}{\text{Unit-time reference dose rate}} = 5.8 \]and
\[ \frac{\text{Accumulated dose at 14 hours after explosion}}{\text{Unit-time reference dose rate}} = 7.1. \]Hence, by subtraction
\[ \frac{\text{Accumulated dose between 2 and 14 hours after explosion}}{\text{Unit-time reference dose rate}} = 1.3. \]The unit-time reference dose rate is 3.8 rads/hr, and so the accumulated dose received in the 12 hours, between 2 and 14 hours after the explosion, is 3.8 × 1.3 = 4.9 rads.
9.22 The percentage of the accumulated “infinity dose” or “infinite time dose” that would be received from a given quantity of early fallout, computed from 1 minute to various times after a nuclear explosion, is shown in Table 9.22. The calculated infinite time dose is essentially equal to the dose that would be accumulated as a result of exposure to a fixed quantity of fallout for many years. These data can be used to determine the proportion of the infinite time dose received during any specified period following the complete deposition of the early fallout. Of course, if the deposition of fallout is incomplete or part is removed, Table 9.22 would not be applicable.
| Time (hours) | Percent of infinite time dose | Time (hours) | Percent of infinite time dose |
|---|---|---|---|
| 1 | 55 | 72 | 86 |
| 2 | 62 | 100 | 88 |
| 4 | 68 | 200 | 90 |
| 6 | 71 | 500 | 93 |
| 12 | 75 | 1,000 | 95 |
| 24 | 80 | 2,000 | 97 |
| 48 | 83 | 10,000 | 99 |
9.23 If an individual is exposed to a certain amount of early fallout during the interval from 2 hours to 14 hours after the explosion, the percentage of the infinite time dose received may be obtained by subtracting the respective values in (or estimated from) Table 9.22, i.e., 76 (for 14 hours) minus 62 (for 2 hours), giving 14 percent, i.e., 0.14, of the infinite time dose. The actual value of the infinite time dose computed from 1 minute after detonation, is 9.3 times the unit-time reference dose rate (in rads/hr), as indicated by t=∞ in Fig. 9.20. Hence, if the reference value is 3.8 rads per hour as in the above example, the accumulated dose received between 2 hours and 14 hours after the burst is 0.14 × 9.3 × 3.8 = 4.9 rads, as before.
9.24 With the aid of Figs. 9.16a and b and Fig. 9.20 (or the equivalent Tables 9.19 and 9. 22) many different types of calculations relating to radiation dose rates and total doses received from early fallout can be made. The procedures can be simplified, however, by means of special charts, as will be shown below. The results, like those already given, are applicable to a particular quantity of fallout. If there is any change in the situation, either by further contamination or by decontamination, the conclusions will not be valid.
9.25 If the radiation dose rate from early fallout is known at a given location, the nomograph in Fig. 9.25 may be used to determine the dose rate at any other time at the same location, assuming there has been no change in the fallout other than natural radioactive decay. The same nomograph can be utilized, alternatively, to determine the time after the explosion at which the dose rate will have attained a specified value. The nomograph is based on the straight line marked “$t^{-1.2}$” in Figs. 9. 16a and b which is seen to deviate only slightly from the continuous decay curve for times less than 6 months or so. It is thus possible to obtain from Fig. 9.25 approximate dose rates, which are within 25 percent of the continuous curve values of Figs. 9.16a and b for the first 200 days after the nuclear detonation.

9.26 To determine the total accumulated radiation dose received during a specified time of stay in an area contaminated with early fallout, if the dose rate in that area at any given time is known, use is made of Fig. 9.26 in conjunction with Fig. 9.25. The chart may also be employed to evaluate the time when a particular operation may be commenced in a contaminated area in order not to exceed a specified accumulated radiation dose.
9.27 Another type of calculation of radiation dose in a contaminated area (from a fixed quantity of fallout) is based on a knowledge of the dose rate at the time when exposure commenced in that area. The procedure described in the examples facing Fig. 9.26, which also requires the use of Fig. 9.25, may then be applied to determine either the total dose received in a specified time of stay or the time required to accumulate a given dose of radiation. The calculation may, however, be simplified by means of Fig. 9.27 which avoids the necessity for evaluating the unit-time reference dose rate, provided the dose rate at the time of entry (or fallout arrival time) in the contaminated area is known.
9.28 If the whole of the early fallout reached a given area within a short time, Fig. 9.27 could be used to determine how the total accumulated radiation dose received by inhabitants of that area would increase with time, assuming no protection. For example, suppose the early fallout arrived at 6 hours after the explosion and the dose rate at that time was R rads per hour; the total dose received would be 9 R rads in 1 day, 12 R rads in 2 days, and 16 R rads in 5 days.
9.29 It is evident that the first day or so after the explosion is the most hazardous as far as the exposure to residual nuclear radiation from the early fallout is concerned. Although the particular values given above apply to the case specified, i.e., complete early fallout arrival 6 hours after the explosion, the general conclusions to be drawn are true in all cases. The radiation doses that would be received during the first day or two are considerably greater than on subsequent days. Consequently, it is in the early stages following the explosion that protection from fallout is most important.
9.30 It is essential to understand that the tables and figures given above, and the calculations of radiation dose rates and doses in which they are used, are based on the assumption that an individual is exposed to a certain quantity of early fallout and remains exposed continuously (without protection) to this same quantity for a period of time. In an actual fallout situation, however, these conditions probably would not exist. For one thing, any shelter which attenuates the radiation will reduce the exposure dose rate (and dose) as given by the calculations. Furthermore, the action of wind and weather will generally tend to disperse the fallout particles in some areas and concentrate them in others. As a result, there may be a change in the quantity of early fallout at a given location during the time of exposure; the radiation dose rate (and dose) would then change correspondingly. The same would be true, of course, if there were additional fallout from another nuclear explosion.
NEUTRON-INDUCED ACTIVITY
9.31 The neutrons liberated in the fission process, but which are not involved in the propagation of the fission chain, are ultimately captured by the weapon residues through which they must pass before they can escape, by nitrogen (especially) and oxygen in the atmosphere, and by various materials present on the earth’s surface (§ 8.16). As a result of capturing neutrons many substances become radioactive. They, consequently, emit beta particles, frequently accompanied by gamma radiation, over an extended period of time following the explosion. Such neutron induced activity, therefore, is part of the residual nuclear radiation.
9.32 The activity induced in the weapon materials is highly variable, since it is greatly dependent upon the design and structural characteristics of the weapon. Any radioactive isotopes produced by neutron capture in the residues will remain associated with the fission products. The curves and tables given above have been adjusted to include the contribution of such isotopes, e.g., uranium-237 and -239 and neptunium-239 and -240. In the period from 20 hours to 2 weeks after the burst, depending to some extent upon the weapon materials, these isotopes can contribute up to 40 percent of the total activity of the weapon debris. At other times, their activity is negligible in comparison with that of the fission products.
9.33 When neutrons interact with oxygen and nitrogen nuclei present in the atmosphere, the resulting radioactivity is of little or no significance, as far as the early residual radiation is concerned. Oxygen-16, for example, reacts to a slight extent with fast neutrons, but the product, an isotope of nitrogen, has a half-life of only 7 seconds. It will thus undergo almost complete decay within a minute or two.
9.34 The product of neutron interaction with nitrogen-14 is carbon-14 (§ 8.110), which is radioactive; it emits beta particles of low energy but no gamma rays. Carbon-14 has a long half-life (5,730 years), so that it decays and emits beta particles relatively slowly. In the form of carbon dioxide it is readily incorporated by all forms of plant life and thus finds its way into the human body. The carbon in all living organisms contains a certain proportion of carbon-14 resulting from the capture by atmospheric nitrogen of neutrons from naturally occurring cosmic rays and from weapons tests. The total reservoir of carbon-14 in nature, including oceans, atmosphere, and biosphere (living organisms), is normally from 50 to 80 tons; of this amount, about 1 ton is in the atmosphere and 0.2 ton in the biosphere. It is estimated that before September 196I weapons testing had produced an additional 0.65 (short) ton of carbon-14 and about half had dissolved in the oceans. As a result of the large number of atmospheric nuclear tests, many of high yield, conducted during 196I and 1962, the excess of carbon-14 in the atmosphere rose to about 1.6 (short) tons in the spring of 1963. By mid-1969, this excess had fallen to about 0.74 ton. In the course of time, more and more of the carbon-14 will enter the oceans and, provided there is no great addition as a result of weapons tests, the level in the atmosphere should continue to decrease. If the rate of decrease of excess carbon-14 in the atmosphere observed between 1963 and 1969 were to continue, the level should fall to less than 1 percent above normal in 40 to 80 years.
9.35 An important contribution to the residual nuclear radiation can arise from the activity induced by neutron capture in certain elements in the earth and in sea water. The extent of this radioactivity is highly variable. The element which probably deserves most attention, as far as environmental neutron-induced activity is concerned, is sodium. Although this is present only to a small extent in average soils, the amount of radioactive sodium-24 formed by neutron capture can be quite appreciable. This isotope has a half-life of 15 hours and emits both beta particles, and more important, gamma rays of relatively high energy.5
9.36 Another source of induced activity is manganese which, being an element that is essential for plant growth, is found in most soils, even though in small proportions. As a result of neutron capture, the radioisotope manganese-56, with a half-life of 2.6 hours, is formed. Upon decay it gives off several gamma rays of high energy, in addition to beta particles. Because its half-life is less than that of sodium-24, the manganese-56 loses its activity more rapidly. But, within the first few hours after an explosion, the manganese in soil may constitute a serious hazard, greater than that of sodium.
9.37 A major constituent of soil is silicon, and neutron capture leads to the formation of radioactive silicon-31. This isotope, with a half-life of 2.6 hours, gives off beta particles, but gamma rays are emitted in not more than about 0.07 percent of the disintegrations. It will be seen later that only in certain circumstances do beta particles themselves constitute a serious radiation hazard. Aluminum, another common constituent of soil, can form the radioisotope aluminum-28, with a half-life of only 2.3 minutes. Although isotopes such as this, with short half lives, contribute greatly to the high initial activity, very little remains within an hour after the nuclear explosion.
9.38 When neutrons are captured by the hydrogen nuclei in water (H2O), the product is the nonradioactive (stable) isotope, deuterium, so that there is no resulting activity. As seen in § 9.33, the activity induced in the oxygen in water can be ignored because of the very short half-life of the product. However, substances dissolved in the water, especially the salt (sodium chloride) in sea water, can be sources of considerable induced activity. The sodium produces sodium-24, as already mentioned, and the chlorine yields chlorine-38 which emits both beta particles and high-energy gamma rays. However, the half-life of chlorine-38 is only 37 minutes, so that within 4 to 5 hours its activity will have decayed to about 1 percent of its initial value.
9.39 Apart from the interaction of neutrons with elements present in soil and water, the neutrons from a nuclear explosion may be captured by other nuclei, such as those contained in structural and other materials. Among the metals, the chief sources of induced radioactivity are probably zinc, copper, and manganese, the latter being a constituent of many steels, and, to a lesser extent, iron. Wood and clothing are unlikely to develop appreciable activity as a result of neutron capture, but glass could become radioactive because of the large proportions of sodium and silicon. Foodstuffs can acquire induced activity, mainly as a result of neutron capture by sodium. However, at such distances from a nuclear explosion and under such conditions that this activity would be significant, the food would probably not be fit for consumption for other reasons, e.g., blast and fire damage. Some elements, e.g., boron, absorb neutrons without becoming radioactive, and their presence will decrease the induced activity
URANIUM AND PLUTONIUM
9.40 The uranium and plutonium which may have escaped fission in the nuclear weapon represent a further possible source of residual nuclear radiation. The common isotopes of these elements emit alpha particles and also some gamma rays of low energy. However, because of their very long half lives, the activity is very small compared with that of the fission products.
9.41 The alpha particles from uranium and plutonium, or from radioactive sources in general, are completely absorbed in an inch or two of air (§ 1.66). This, together with the fact that the particles cannot penetrate ordinary clothing, indicates that uranium and plutonium deposited on the earth do not represent a serious external hazard. Even if they actually come in contact with the body, the alpha particles emitted are unable to penetrate the unbroken skin.
9.42 Although there is negligible danger from uranium and plutonium outside the body, it is possible for dangerous amounts of these elements to enter the body through the lungs, the digestive system, or breaks in the skin. Plutonium, for example, tends to concentrate in bone and lungs, where the prolonged action of the alpha particles can cause serious harm (Chapter XII).
9.43 At one time it was suggested that the explosion of a sufficiently large number of nuclear weapons might result in such an extensive distribution of the plutonium as to represent a worldwide hazard. It is now realized that the fission products-the radioisotope strontium-90 in particular-are a more serious hazard than plutonium is likely to be. Further, any steps taken to minimize the danger from fission products, which are much easier to detect, will automatically reduce the hazard from the plutonium.
TRITIUM
9.44 The interaction of fast neutrons in cosmic rays with nitrogen nuclei in the air leads to the formation of some tritium in the normal atmosphere; this radioactive isotope of hydrogen has a half-life of about 12.3 years. Small amounts of tritium are formed in fission but larger quantities result from the explosion of thermonuclear weapons. The fusion of deuterium and tritium proceeds much more rapidly than the other thermonuclear reactions (§ 1.69) so that most of the tritium present (or formed in the D-D and Li-n reactions) is consumed in the explosion. Nevertheless, some residual quantity will remain. Tritium is also produced by the interaction of nitrogen nuclei in the air with high energy neutrons released in the fusion reactions. Most of the tritium remaining after a nuclear explosion, as well as that produced by cosmic rays, is rapidly converted into tritiated water, HTO; this is chemically similar to ordinary water (H2O) and differs from it only in the respect that an atom of the radioactive isotope tritium (T) replaces one atom of ordinary hydrogen (H). If the tritiated water should become associated with natural water, it will move with the latter.
9.45 The total amount of tritium on earth, mostly in the form of tritiated water, attained a maximum in 1963, after atmospheric testing by the United States and the U.S.S.R. had ceased. The amount was then about 16 to 18 times the natural value, but this has been decreasing as a result of radioactive decay. By the end of the century, there will have been a decrease by a factor of eight or so from the maximum, provided there are no more than a few nuclear explosions in the atmosphere. A portion of the tritium produced remains in the lower atmosphere, i.e., the troposphere, whereas the remainder ascends into the stratosphere (see Fig. 9.126). The tritiated water in the troposphere is removed by precipitation and at times, in 1958 and 1963, following extensive nuclear weapons test series, the tritiated water in rainfall briefly reached values about 100 times the natural concentration. Tritium in the stratosphere is re moved slowly, so that substantial amounts are still present in this region of the atmosphere. As a general rule, the tritium (and other weapons debris) must descend into the troposphere before scavenging by rain or snow can be effective (§ 9.135).
9.46 When tritium decays it emits a beta particle of very low energy but no gamma rays. Consequently, it does not represent a significant external radiation hazard. In principle, however, it could be an internal hazard. Natural water is relatively mobile in the biosphere and any tritiated water present will be rapidly dispersed and become available for ingestion by man through both food and drink. But the hazard is greatly reduced by the dilution of the tritiated water with the large amounts of ordinary water in the environment. On the whole, the internal radiation dose from tritium is relatively unimportant when compared with the external (or internal) dose from fission products (§ 12.199).
CLEAN AND DIRTY WEAPONS
9.47 The terms “clean” and “dirty” are often used to describe the amount of radioactivity produced by a fusion weapon (or hydrogen bomb) relative to that from what might be de scribed as a “normal” weapon. The latter may be defined as one in which no special effort has been made either to increase or to decrease the amount of radioactivity produced for the given explosion yield. A “clean” weapon would then be one which is designed to yield significantly less radioactivity than an equivalent normal weapon. Inevitably, however, any fusion weapon will produce some radioactive species. Even if a pure fusion weapon, with no fission, should be developed, its explosion in air would still result in the formation of carbon-14, tritium, and possibly other neutron-induced activities. If special steps were taken in the design of a fusion device, e.g., by salting(§ 9.11), so that upon detonation it generated more radioactivity than a similar normal weapon, it would be described as “dirty.” By its very nature, a fission weapon must be regarded as being dirty.
RADIOACTIVE CONTAMINATION FROM NUCLEAR EXPLOSION
AIR BURSTS
9.48 An air burst, by definition, is one taking place at such a height above the earth that no appreciable quantities of surface materials are taken up into the fireball. The radioactive residues of the weapon then condense into very small particles with diameters in the range of 0.01 to 20 micrometers (see § 2.27 footnote) The nuclear cloud carries these particles to high altitudes, determined by the weapon yield and the atmospheric conditions. Many of the particles are so small that they fall extremely slowly under the influence of gravity, but they can diffuse downward and be deposited by atmospheric turbulence. The deposition takes place over such long periods of time that the particles will have become widely distributed and their concentration thereby reduced. At the same time, the radioactivity will have decreased as a result of natural decay. Consequently, in the absence of precipitation, i.e., rain or snow(§ 9.67), the deposition of early fallout from an air burst will generally not be significant.
9.49 An air burst, however, may produce some induced radioactive contamination in the general vicinity of ground zero as a result of neutron capture by elements in the soil. The extent of the contamination will depend on the characteristics of the weapon, e.g., fusion and fission energy yields, the height of burst, and the composition of the surface material. The residual radioactivity which would arise in this manner will thus be highly variable, but it is probable that where the induced activity is substantial, all buildings except strong underground structures would be destroyed by blast and fire.
LAND SURFACE AND SUBSURFACE BURSTS
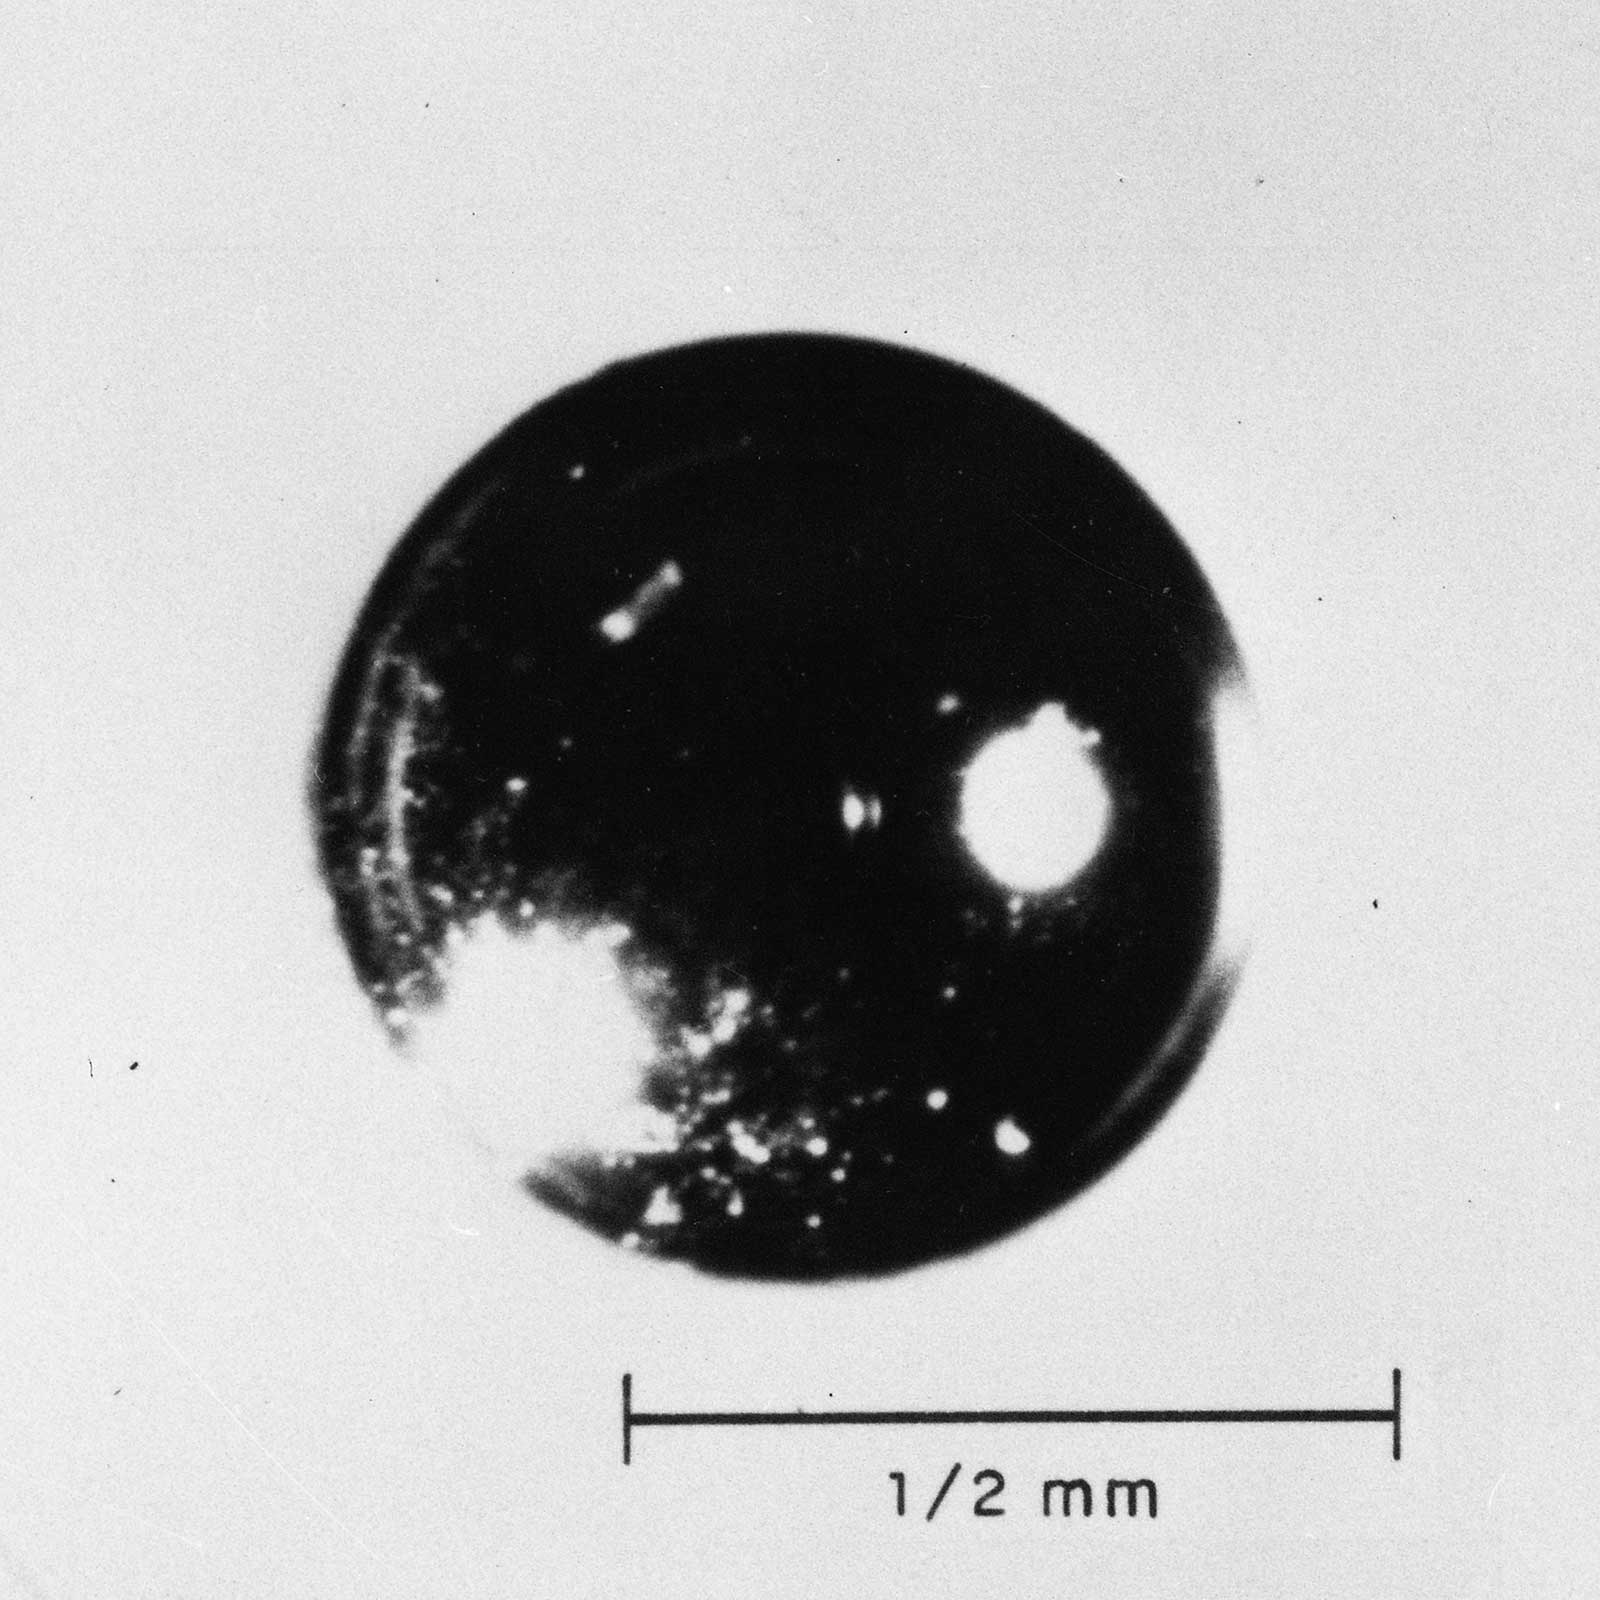
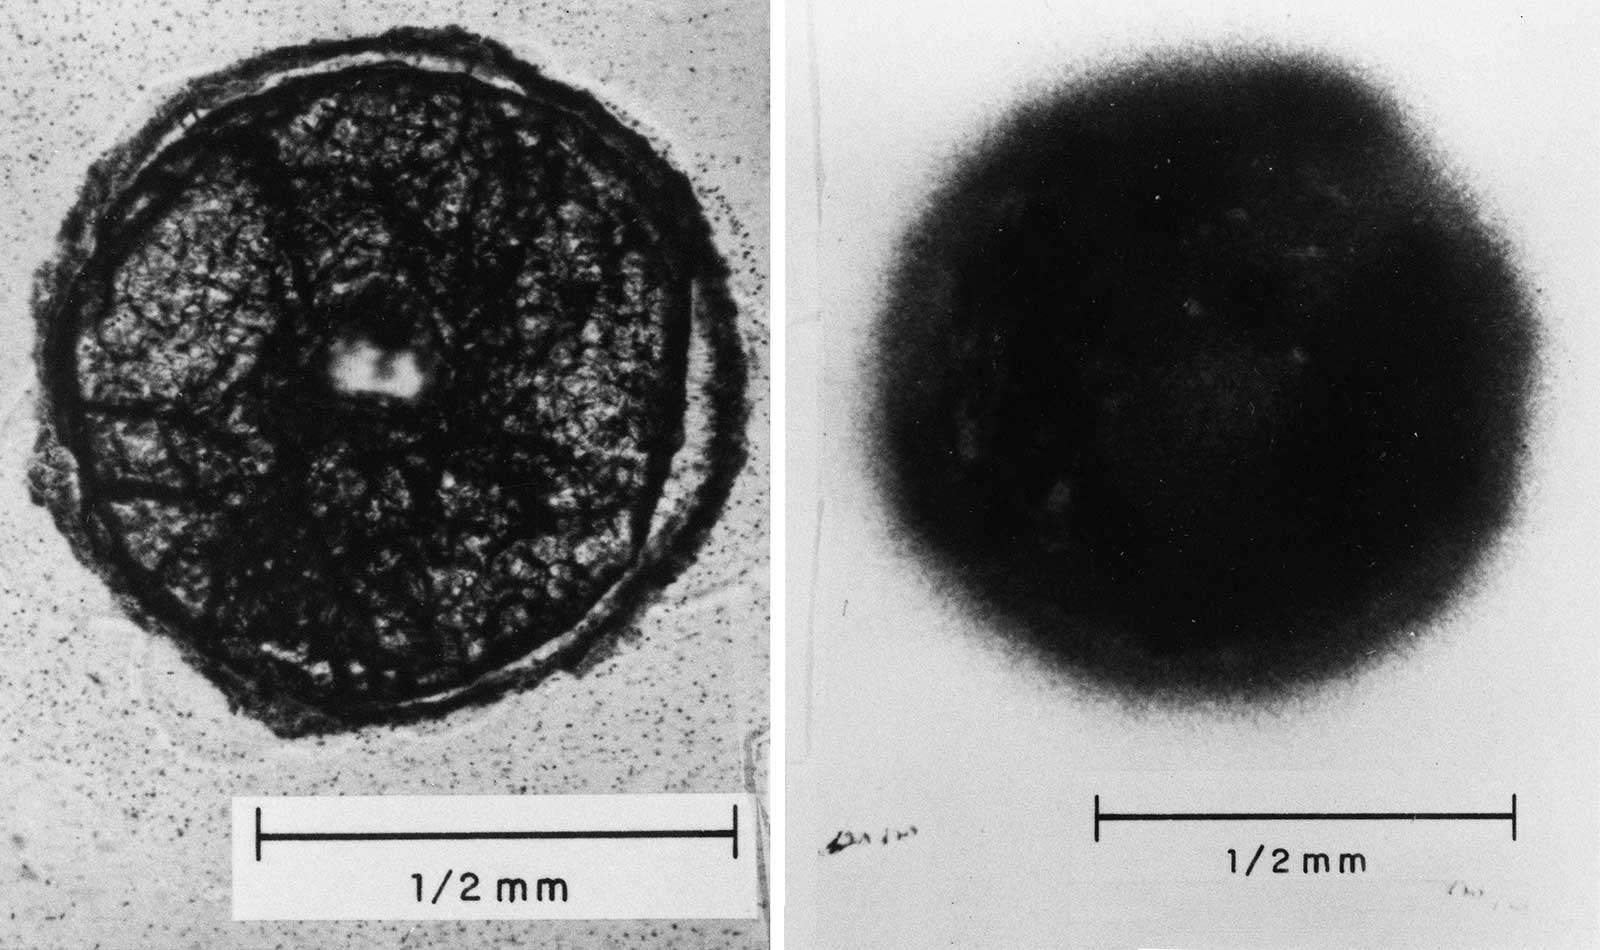
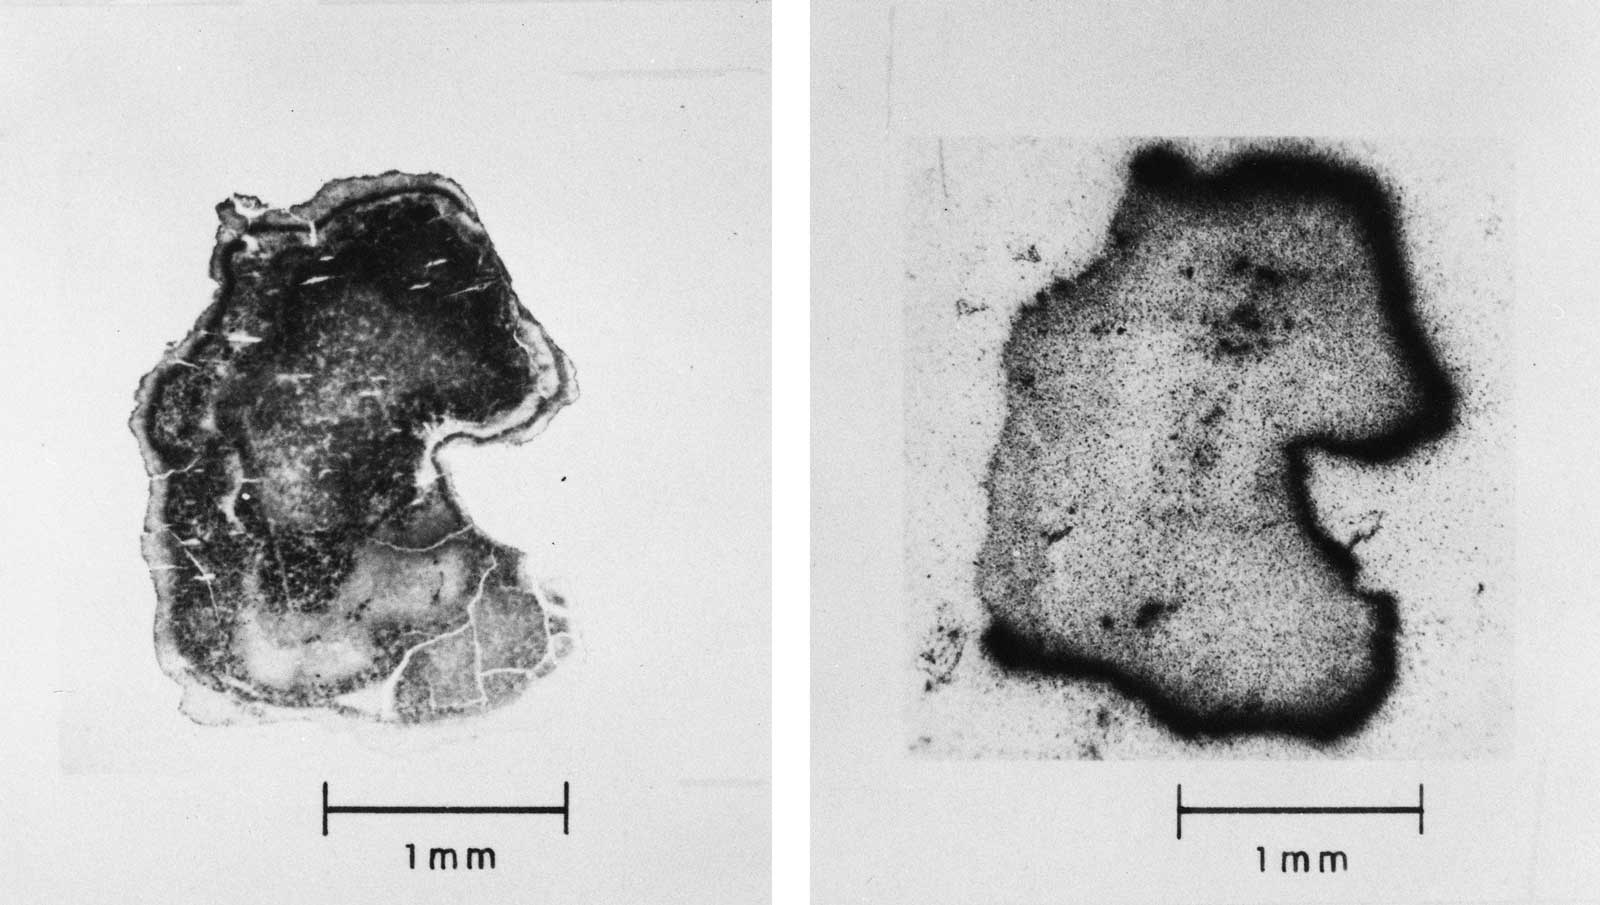
9.50 As the height of burst decreases, earth, dust, and other debris from the earth’s surface are taken up into the fireball; an increasing proportion of the fission (and other radioactive) products of the nuclear explosion then condense onto particles of appreciable size. These contaminated particles range in diameter from less than I micron to several millimeters; the larger ones begin to fall back to earth even before the radioactive cloud has attained its maximum height, whereas the very smallest ones may remain suspended in the atmosphere for long periods. In these circumstances there will be an early fallout, with the larger particles reaching the ground within 24 hours. Photographs of typical fallout particles are shown in Figs. 9.50a through d. The distribution of the radioactivity of the particles is indicated by the autoradio graphs, i.e., self-photographs produced by the radiations. As a general rule, the contamination is confined to the surface of the particle, but in some cases the distribution is uniform throughout, indicating that the particle was molten when it incorporated the radioactive material.

9.51 The extent of the contamination of the earth’s surface due to the residual nuclear radiation following a land surface or subsurface burst depends primarily on the location of the burst point. There is a gradual transition in behavior from a high air burst, at one extreme, where all the radioactive residues are injected into the atmosphere, to a deep subsurface burst, at the other extreme, where the radioactive materials remain below the surface. In neither case will there be any significant local fallout. Between these two extremes are surface and near-surface bursts which will be accompanied by extensive contamination due to early fallout. A shallow subsurface burst, in which part of the fireball emerges from the ground, is essentially similar to a surface burst. The distribution of the early fallout from surface and related explosions is determined by the total and fission yields, and the depth or height of burst, the nature of the soil, and the wind and weather conditions. These matters will be discussed in some detail later in this chapter.
9.52 For a subsurface burst that is not too deep, but deep enough to prevent emergence of the fireball, a considerable amount of dirt is thrown up as a column in the air and there is also crater formation. Much of the radioactive material will remain in the crater area, partly because it does not escape and partly because the larger pieces of contaminated rock, soil, and debris thrown up into the air will descend in the vicinity of the explosion (Chapter VI). The finer particles produced directly or in the form of a base surge (§ 2.96) will remain suspended in the air and will descend as fallout at some distance from ground zero.
WATER SURFACE AND UNDERWATER BURSTS
9.53 The particles entering the atmosphere from a sea water surface or shallow subsurface burst consist mainly of sea salts and water drops. When dry, the particles are generally smaller and lighter than the fallout particles from a land burst. As a consequence of this difference, sea water bursts produce less close-in fallout than do similar land surface bursts. In particular, water surface and shallow underwater bursts are often not associated with a region of intense residual radioactivity near surface zero. Possible exceptions, when such a region does occur, are water surface bursts in extremely humid atmospheres or in shallow water. If the humidity is high, the hygroscopic, i.e., water-absorbing, nature of the sea salt particles may cause a cloud seeding effect leading to a local rainout of radioactivity.
9.54 The early residual radioactivity from a water burst can arise from two sources: (1) the base surge if formed (§ 2.72 et seq.) and (2) the radioactive material, including induced radioactivity, remaining in the water. The base surge is influenced strongly by the wind, moving as an entity at the existing wind speed and direction. Initially, the base surge is highly radioactive, but as it expands and becomes diluted the concentration of fission products, etc., decreases. This dispersion, coupled with radioactive decay, results in comparatively low dose rates from the base surge by about 30 minutes after the burst(§ 2.77 et seq.).
9.55 The radioactivity in the water is initially present in a disk-like “pool,” usually not more than 300 feet deep, near the ocean surface which is moved by the local currents. The pool gradually expands into a roughly annular form, but it reverts to an irregular disk shape at later times. Eventually, downward mixing and horizontal turbulent diffusion result in a rapid dilution of the radioactivity, thus reducing the hazard with time.
9.56 In the Bikini BAKER test (§ 2.63), the contaminated fallout (or rainout) consisted of both solid particles and a slurry of sea salt crystals in drops of water. This contamination was difficult to dislodge and had there been personnel on board the ships used in the test, they would have been subjected to considerable doses of radiation if the fallout were not removed immediately.6 Since the BAKER shot was fired in shallow water, the bottom material may have helped in the scavenging of the radioactive cloud, thus adding to the contamination. It is expected that for shallow bursts in very deep water the fallout from the cloud will be less than observed at the test in Bikini lagoon.
9.57 An indication of the rate of spread of the active material and the decrease in the dose rate following a shallow underwater burst is provided by the data in Table 9.57, obtained after the Bikini BAKER test. Although the dose rate in the water was still fairly high after 4 hours, there would be considerable attenuation in the interior of a ship, so that during the time required to cross the contaminated area the total dose received would be small. Within 2 or 3 days after the BAKER test the radioactivity had spread over an area of about 50 square miles, but the radiation dose rate in the water was so low that the region could be traversed in safety.
| Time after explosion (hours) | Contaminated area (square miles) | Mean diameter (miles) | Maximum dose rate (rads/hr) |
|---|---|---|---|
| 4 | 16.6 | 4.6 | 3.1 |
| 38 | 18.4 | 4.8 | 0.42 |
| 62 | 48.6 | 7.9 | 0.21 |
| 86 | 61.8 | 8.9 | 0.042 |
| 100 | 70.6 | 9.5 | 0.025 |
| 130 | 107 | 11.7 | 0.008 |
| 200 | 160 | 14.3 | 0.0004 |
9.58 The residual radiation dose rates and doses from the base surge and pool resulting from an underwater nuclear explosion vary significantly with weapon yield and burst depth, proximity of the ocean bottom to the point of detonation, wind velocity, and current velocity. Consequently, the residual radiation distribution associated with an underwater burst is complex, and there is no simplified prediction system suitable for general application, such as has been developed for land surface bursts (§ 9.79 et seq.).
FALLOUT DISTRIBUTION IN LAND SURFACE BURSTS
DISTRIBUTION OF CONTAMINATION
9.59 More is known about the fall out from land surface and near-surface bursts than for other types of explosions. Consequently, the remainder of this chapter will be concerned mainly with the radioactive contamination resulting from bursts at or near the ground surface. The proportion of the total radioactivity of the weapon residues that is present in the early fallout, sometimes called the “early fallout fraction,” varies from one test explosion to another. For land surface bursts the early fallout fraction, which depends on the nature of the surface material, has been estimated to range from 40 to 70 per cent. Values somewhat higher than this are expected for shallow underground bursts. For water surface bursts, however, the fraction is generally lower, in the neighborhood of 20 to 30 percent, for the reason given in § 9.53. Some variability is expected in the fallout fraction for a given type of burst due to variations in environmental and meteorological conditions. Nevertheless, it will be assumed here that 60 percent of the total radioactivity from a land surface burst weapon will be in the early fallout. The remainder will contribute to the delayed fallout, most of which undergoes substantial radioactive decay and, hence, decreases in activity before it eventually reaches the ground many hundreds or thousands of miles away (§ 9.121 et seq.).
9.60 The distribution on the ground of the activity from the early fallout, i.e., the “fallout pattern,” even for similar nuclear yields, also shows great variability. In addition to the effect of wind, such factors as the dimensions of the radioactive cloud, the distribution of radioactivity within the mushroom head, and the range of particle sizes contribute to the uncertainty in attempts to predict the fallout pattern.
9.61 The spatial distribution of radioactivity within the cloud is not known accurately, but some of the gross features have been derived from observations and theoretical considerations. It is generally accepted that, of the total activity that is lofted, the mushroom head from a contact land-surface burst initially contains about 90 percent with the remainder residing in the stem. The proportion of activity in the stem may be even less for a water surface burst and almost zero for an air burst. However, it appears that some radioactive particles from the mushroom head fall or are transported by subsiding air currents to lower altitudes even before the cloud reaches its maximum height. In addition to the radioactivity in the mushroom head and the stem, a considerable quantity of radioactivity from a surface burst is contained in the fallback in the crater and in the ejecta scattered in all directions around ground zero (Chapter VI). There is some evidence that, for explosions in the megaton range, the highest concentration of radioactivity initially lies in the lower third of the head of the mushroom cloud. It is probable, too, that in detonations of lower yield, a layer of relatively high activity exists somewhere in the cloud. The location of the peak concentration appears to vary with different detonations, perhaps as a function of atmospheric conditions.
9.62 Because particles of different sizes descend at different rates and carry different amounts of radioactive contamination, the fallout pattern will depend markedly on the size distribution of the particles in the cloud after condensation has occurred. In general, larger particles fall more rapidly and carry more activity, so that a high proportion of such particles will lead to greater contamination near ground zero, and less at greater distances, than would be the case if small particles predominated.
9.63 The particle size distribution in the radioactive cloud may well depend on the nature of the material which becomes engulfed by the fireball. A surface burst in a city, for example, could result in a particle size distribution and consequent fallout pattern which would differ from those produced under test conditions either in Nevada or in the Pacific. However, in the absence of any definite evidence to the contrary, it is generally assumed that the fallout pattern for a surface burst in a large city will not differ greatly from those associated with surface and tower shots in the Nevada desert. This may not be the same as the patterns observed at tests in Pacific Ocean atolls.
AREA OF CONTAMINATION
9.64The largest particles fall to the ground from the radioactive cloud and stem shortly after the explosion and hence are found within a short distance of surface zero. Smaller particles, on the other hand, will require many hours to fall to earth. During this period they may be carried hundreds of miles from the burst point by the prevailing winds. The very smallest particles have no appreciable rate of fall and so they may circle the earth many times before reaching the ground, generally in precipitation with rain or snow.
9.65 The fact that smaller particles from the radioactive cloud may reach the ground at considerable distances from the explosion means that fallout from a surface burst can produce serious contamination far beyond the range of other effects, such as blast, shock, thermal radiation, and initial nuclear radiation. It is true that the longer the cloud particles remain suspended in the air, the lower will be their activity when they reach the ground. However, the total quantity of contaminated material produced by the surface burst of a megaton weapon with a high fission yield is so large that fallout may continue to arrive in hazardous concentrations up to perhaps 24 hours after the burst. Radioactive contamination from a single detonation may thus affect vast areas and so fallout must be regarded as one of the major effects of nuclear weapons.
9.66 An important factor determining the area covered by appreciable fallout, as well as its distribution within that area. is the wind pattern from the ground to the top of the radioactive cloud. The direction and speed of the wind at the cloud level will influence the motion and extent of the cloud itself. In addition, the winds at lower altitudes, which may change both in time and space, will cause the fallout particles to drift one way or another while they descend to earth. The situation may be further complicated by the effect of rain (see below) and of irregularities in the terrain. These, as well as nonuniform distribution of activity in the cloud and fluctuations in the wind speed and direction, will contribute to the development of “hotspots” of much higher activity than in the immediate surroundings.
DEPOSITION OF RADIOACTIVE DEBRIS BY PRECIPITATION
9.67 If the airborne debris from a nuclear explosion should encounter a region where precipitation is occurring, a large portion of the radioactive particles may be brought to earth with the rain or snow. The distribution of the fallout on the ground will then probably be more irregular than in the absence of precipitation, with heavy showers producing local hot spots within the contaminated area. Although an air burst does not normally produce any early fallout, precipitation in or above the nuclear cloud could, however, cause significant contamination on the ground as a result of scavenging of the radioactive debris by rain or snow. Precipitation can also affect the fallout from a surface or subsurface burst, mainly by changing the distribution of the local contamination that would occur in any event. Fallout from the cloud stem in a surface burst of high yield should not be greatly influenced by precipitation, since the particles in the stem will fall to earth in a relatively short time regardless of whether there is precipitation or not. 9.68 A number of circumstances affect the extent of precipitation scavenging of the stabilized nuclear cloud. The first requirement is, of course, that the nuclear cloud should be within or below the rain cloud. If the nuclear cloud is above the rain cloud, there will be no scavenging. The altitudes of the top of rain (or snow) clouds range from about 10,000 to 30,000 feet, with lighter precipitation generally being associated with the lower altitudes. The bottom of the rain cloud, from which the precipitation emerges, is commonly at an altitude of about 2,000 feet. Precipitation from thunderstorms, however, may originate as high as 60,000 feet. For low air or surface bursts, the height and depth of the nuclear cloud may be obtained from Fig. 9.96 and these data may be used to estimate the fraction of this cloud that might be intercepted by precipitation. For explosion yields up to about 10 kilotons essentially all of the nuclear cloud, and for yields up to 100 kilotons at least part of the cloud could be subject to scavenging. For yields in excess of about 100 kilotons, precipitation scavenging should be insignificant. But if the nuclear cloud should encounter a thunderstorm region, it is possible that all of the cloud from explosions with yields up to several hundred kilotons and a portion from yields in the megaton range may be affected by precipitation.
9.69 If the horizontal diameter of the rain cloud is less than that of the nuclear cloud, only that portion of the latter that is below (or within) the rain cloud will be subject to scavenging. If the rain cloud is the larger, then the whole of the nuclear cloud will be available for precipitation scavenging. The length of time during which the nuclear cloud is accessible for scavenging will depend on the relative directions and speed of travel of the nuclear and rain clouds.
9.70 The time, relative to the burst time, at which the nuclear cloud encounters a region of precipitation is expected to have an important influence on the ground contamination resulting from scavenging. If the burst occurs during heavy precipitation or if heavy precipitation begins at the burst location during the period of cloud stabilization, a smaller area on the ground will be contaminated but the dose rate will be higher than if the nuclear cloud encountered the rain cloud at a later time. Even for such early encounters, the dose rates near ground zero will be lower than after a surface burst with or without precipitation. If the rainfall is light, the scavenging will be less efficient, and the ground distribution pattern will be elongated if the nuclear cloud drifts with the wind but remains in the precipitation system.
9.71 If the nuclear cloud should enter a precipitation region at some time after the burst, the surface contamination caused by scavenging will be decreased. In the first place, while the cloud is drifting, the radioactive nuclides(§ 1.30) decay continuously. Thus, the longer the elapsed time before the nuclear cloud encounters precipitation, the smaller will be the total amount of radioactive material present. Furthermore, the nuclear cloud, especially from a low-altitude burst, tends to increase in size horizontally with time, due to wind shear and eddy diffusion, without drastic change in the vertical dimensions, unless precipitation scavenging should occur. This increase in horizontal dimensions will decrease the concentration of radioactive particles available for scavenging. Finally, the particles that are scavenged will not be deposited on the ground immediately but will fall with the precipitation (typically 800 to 1,200 feet per minute for rain and 200 feet per minute for snow). Since the particles are scavenged over a period of time and over a range of altitudes, horizontal movement during their fall will tend to decrease the concentration of radioactivity (and dose rate) on the ground. The horizontal movement during scavenging and deposition will result in elongated surface fallout patterns, the exact shape depending on the wind shear.
9.72 After the radioactive particles have been brought to the ground by scavenging, they may or may not stay in place. There is a possibility that water runoff will create hot spots in some areas while decreasing the activity in others. Some of the radioactive material may be dissolved out by the rain and will soak into the ground. Attenuation of the radiations by the soil may then reduce the dose rates above the ground surface.
9.73 Much of what has been stated concerning the possible effects of rain on fallout from both surface and air bursts is based largely on theoretical considerations. Nuclear test operations have been conducted in such a manner as to avoid the danger of rainout. The few recorded cases of rainout which have occurred have involved very low levels of radioactivity and the possibility of severe contamination under suitable conditions has not been verified. Nevertheless, there is little doubt that precipitation scavenging can affect the fallout distribution on the ground from both air and surface bursts with yields in the appropriate range. Because of the many variables in precipitation scavenging, the extent and level of surface contamination to be expected are uncertain. Some estimates have been made, however, of the amounts of rainfall necessary to remove given percentages of the radioactive particles from a nuclear cloud. These estimates are based partly on field experiments with suspended particles and partly on mathematical models for use with a computer; the results are thus dependent on the details of the model, e.g., particle size distribution.
9.74 Two types of precipitation scavenging have been treated in this manner: “rainout” (or “snowout”), when the nuclear cloud is within the rain (or snow) cloud, and “washout” when the nuclear cloud is below the rain (or snow) cloud. The rainfall rate appears to have little effect on rainout but washout is affected to a marked extent. The data in Tables 9. 74a and b give rough estimates of the amounts of rainfall, expressed as the duration, required for the removal of specified percentages of the nuclear cloud particles by rainout and washout; the terms light, moderate, and heavy in Table 9.74b refer to 0.05, 0.20, and 0.47 inch of rain per hour, respectively, as measured at the surface. Thus, it appears that washout is a less effective scavenging mechanism than rainout. The tabulated values are based on the assumption that the nuclear and rain clouds remain in the same relative positions, with the rain cloud at least as large as the nuclear cloud (§ 9.69). It should be noted that the times in Tables 9.74 4a and b are those required for the radioactive debris to be removed by the rain; additional time will elapse before the radioactivity is deposited on the ground. The deposition time will depend on the altitude at which the debris is scavenged and the rate of fall of the rain.
| Percent of Cloud Scavenged | Duration of Rainfall (hours) |
|---|---|
| 25 | 0.07 |
| 50 | 0.16 |
| 75 | 0.32 |
| 90 | 0.53 |
| 99 | 1.1 |
| Duration of Rainfall (hours) | |||
|---|---|---|---|
| Percent of Cloud Scavenged | Light | Moderate | Heavy |
| 25 | 8 | 1.6 | 0.8 |
| 50 | 19 | 3.8 | 1.9 |
| 75 | 38 | 7.7 | 3.6 |
| 90 | 64 | 13 | 6.4 |
| 99 | 128 | 26 | 13 |
FALLOUT PATTERNS
9.75 Information concerning fallout distribution has been obtained from observations made during nuclear weapons tests at the Nevada Test Site and the Eniwetok Proving Grounds.7 However, there are many difficulties in the analysis and interpretation of the results, and in their use to predict the situation that might arise from a land surface burst over a large city. This is particularly the case for the megaton-range detonations at the Eniwetok Proving Grounds. Since the fallout descended over vast areas of the Pacific Ocean, the contamination pattern of a large area had to be inferred from a relatively few radiation dose measurements (§ 9.105). Furthermore, the presence of seawater affected the results, as will be seen below.
9.76 Nuclear tests in the atmosphere in Nevada have been confined to weapons having yields below 100 kilo tons and most of the detonations were from the tops of steel towers 100 to 700 feet high or from balloons at levels of 400 to 1,500 feet. None of these could be described as a true surface burst and, in any event, in the tower shots there is evidence that the fallout was affected by the tower. There have been a few surface bursts, but the energy yields were about 1 kiloton or less, so that they provided relatively little useful information concerning the effects to be expected from weapons of higher energy. Tests of fusion weapons with yields up to 15 megatons TNT equivalent have been made at the Pacific Ocean test sites. A very few were detonated on atoll islands, but most of the shots in the Bikini and Eniwetok Atolls in 1958 were fired on barges in the lagoons or on coral reefs. In all cases, however, considerable quantities of seawater were drawn into the radioactive cloud, so that the fallout was probably quite different from what would have been associated with a true land surface burst.
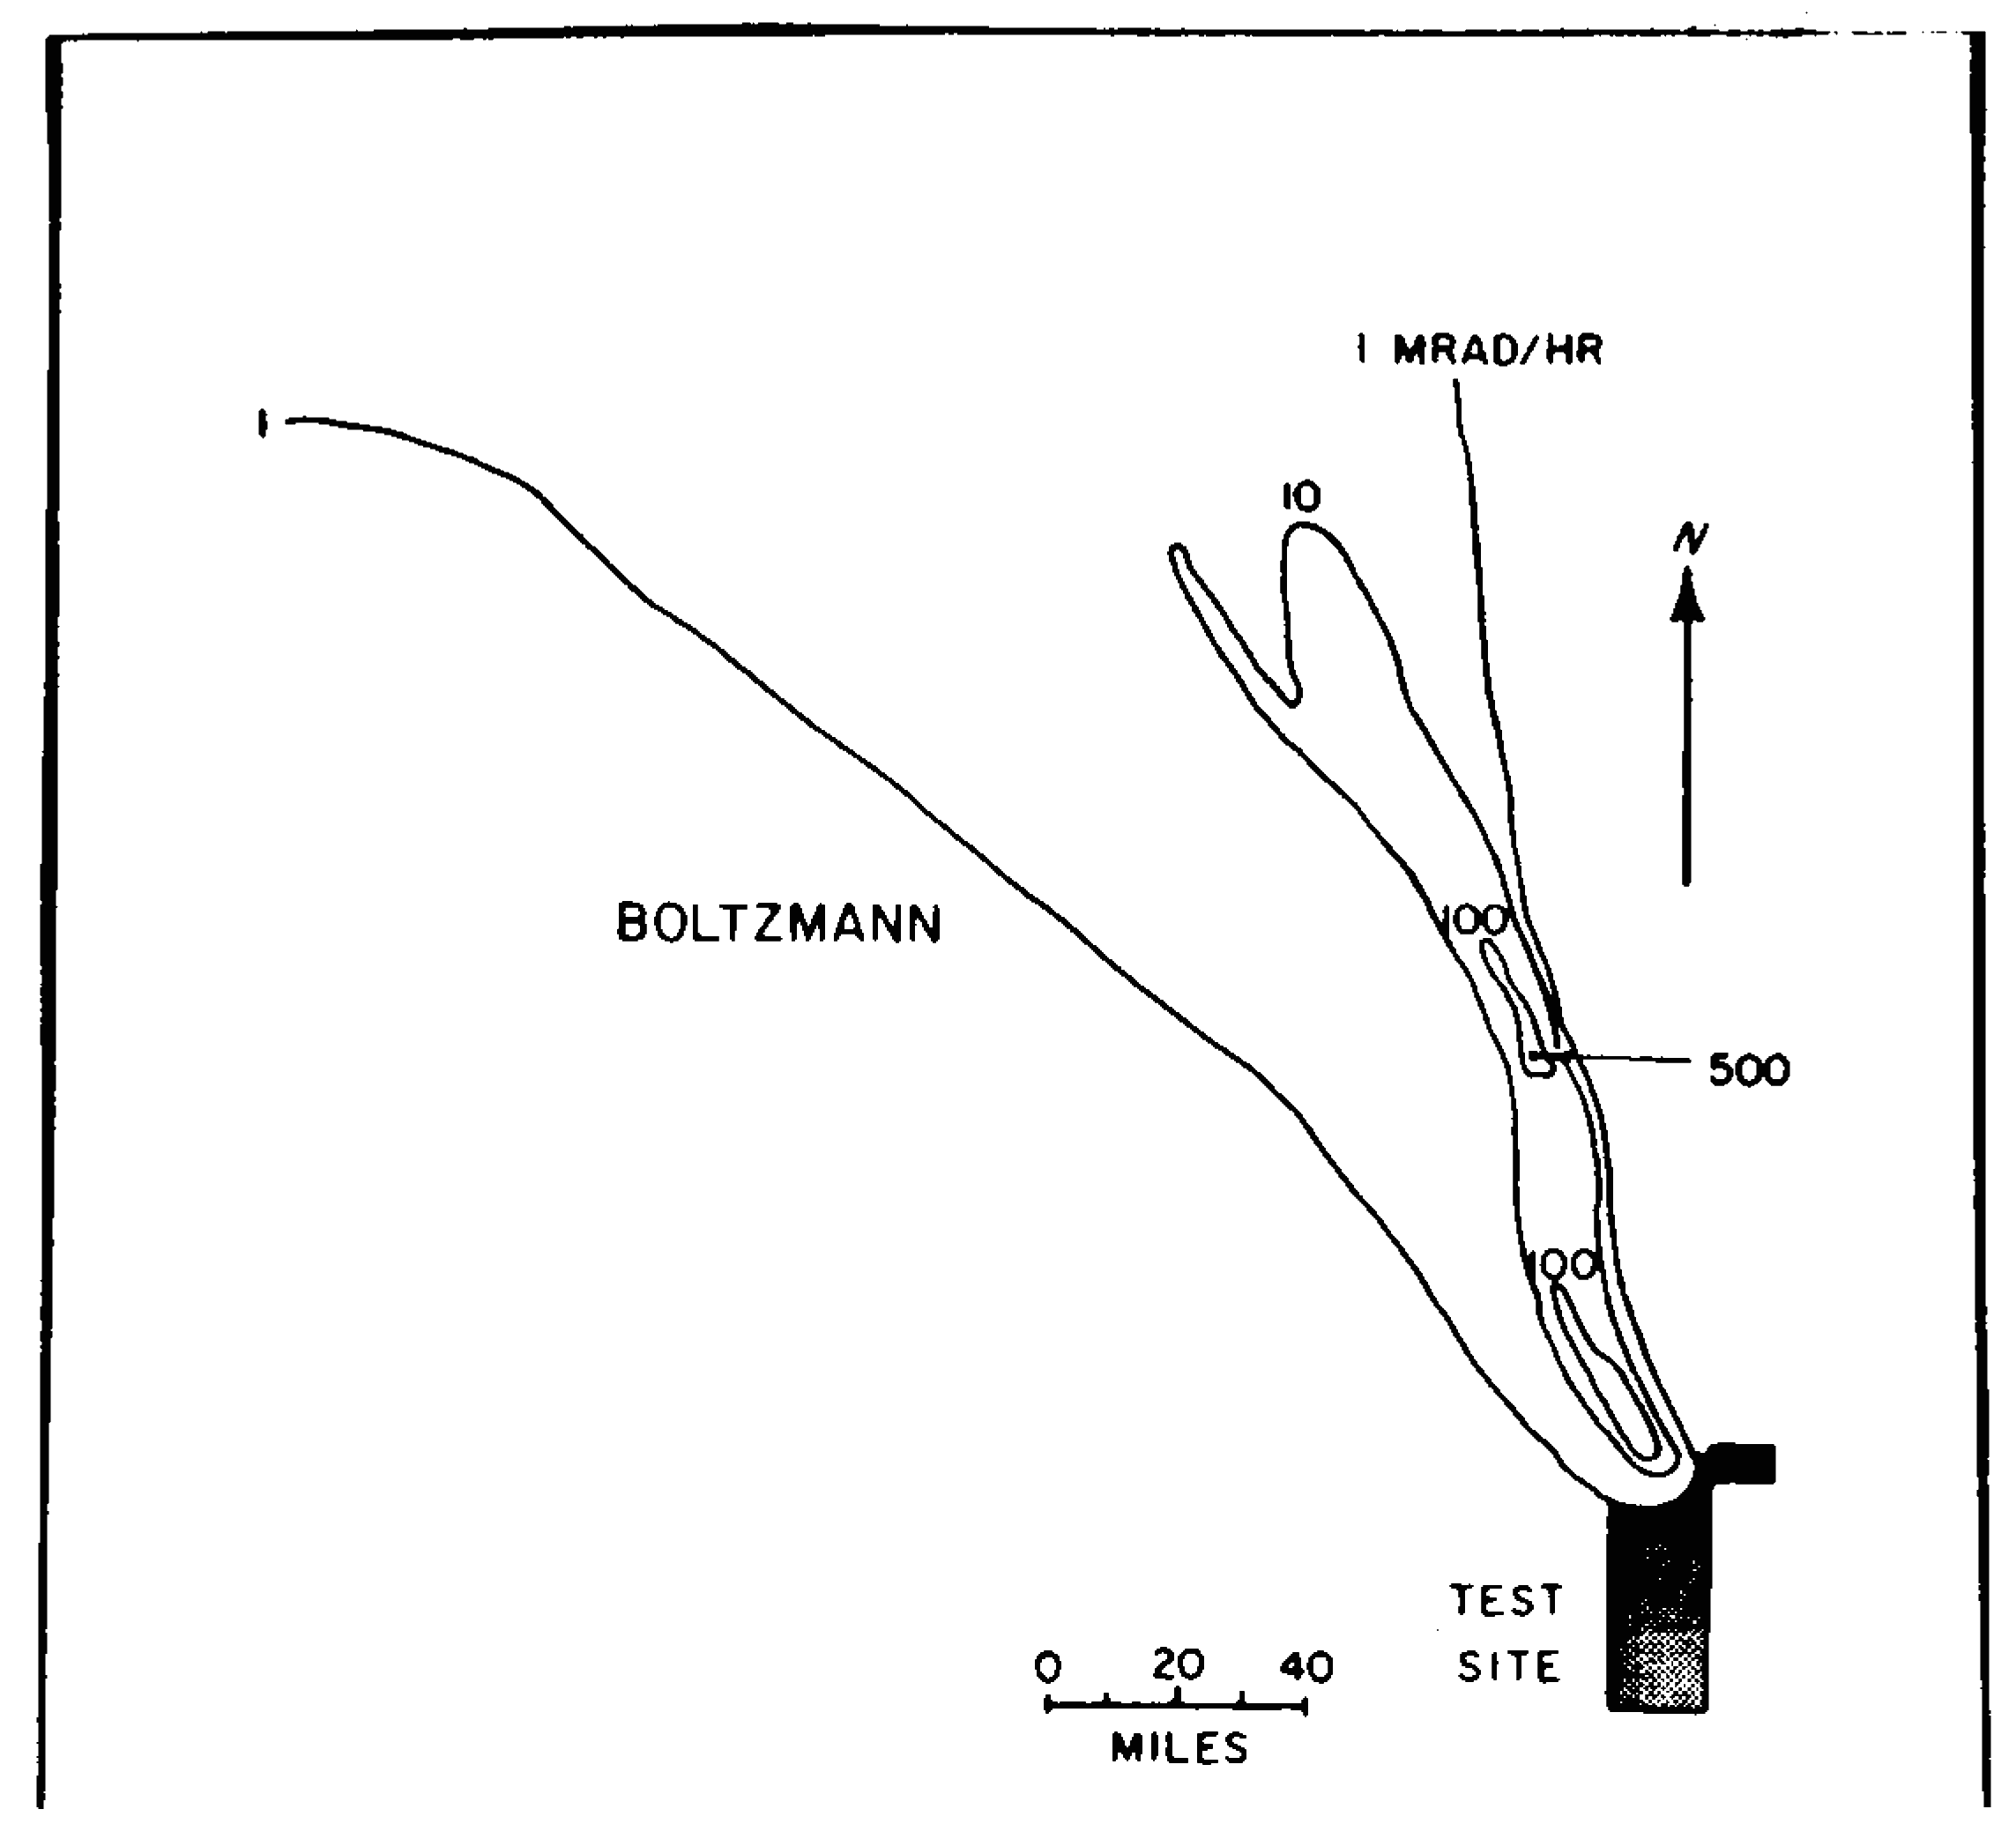
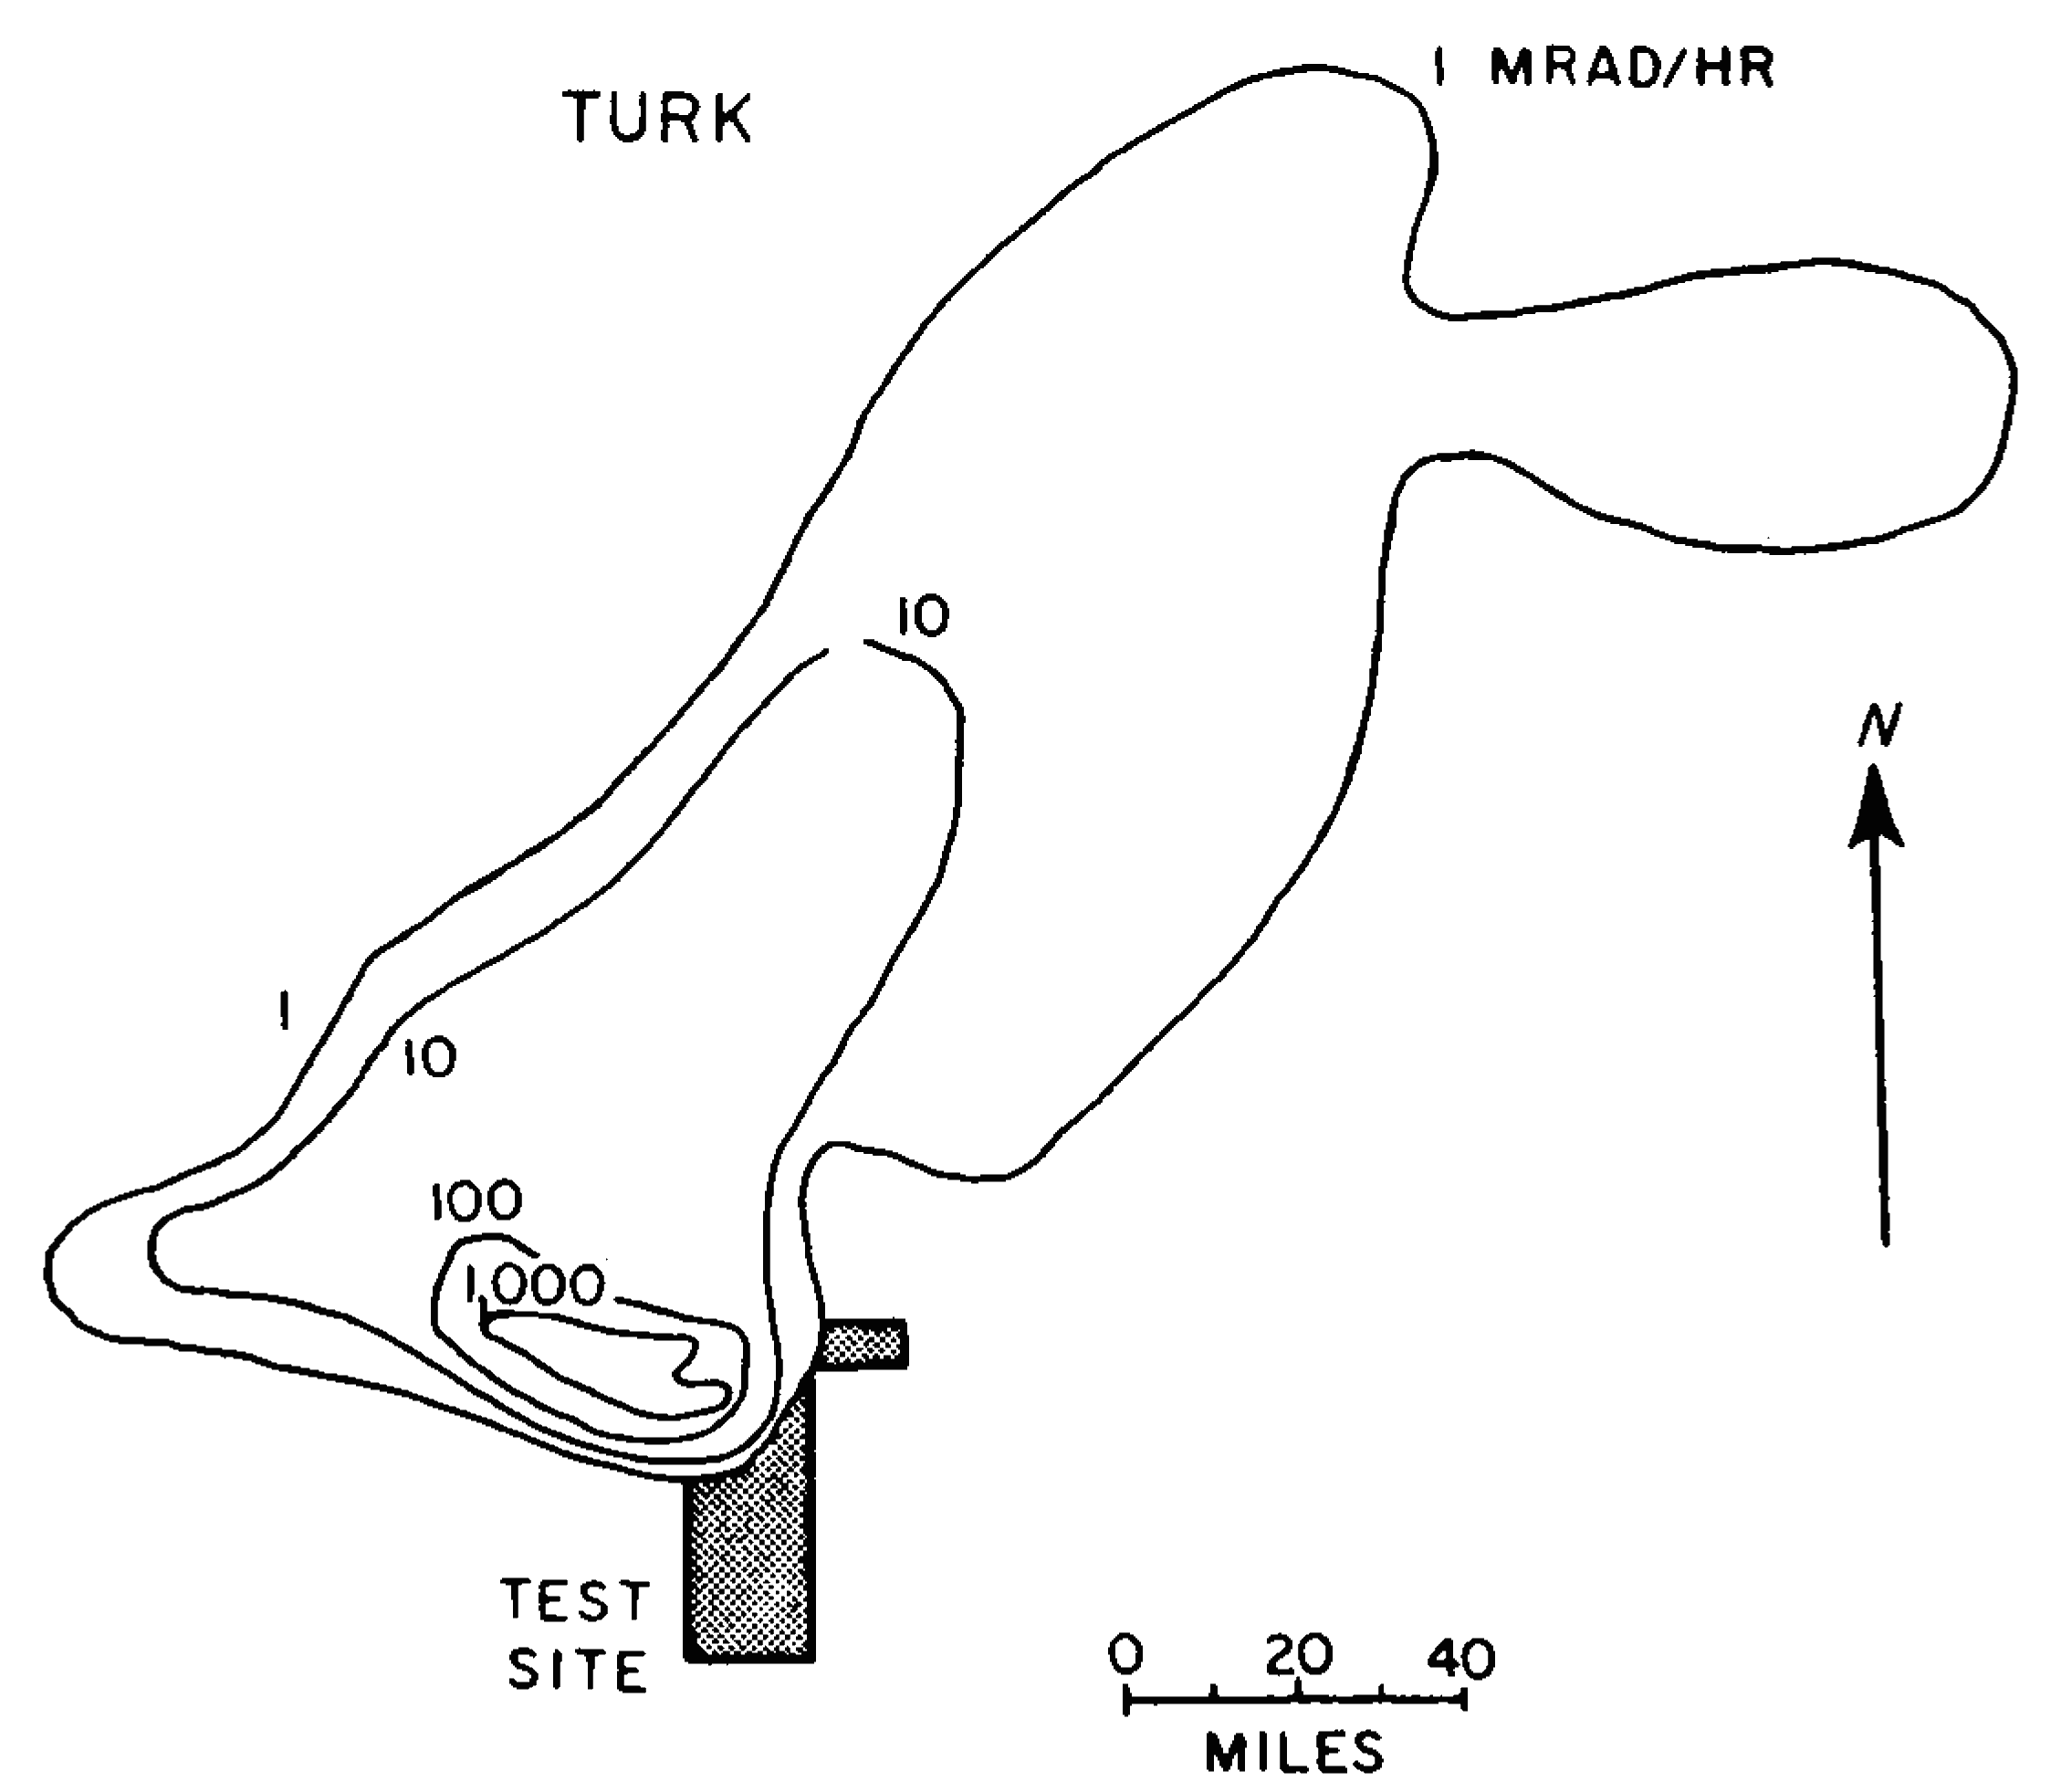
9.77 The irregular nature of the fallout distribution from two tests in Nevada is shown by the patterns in Figs. 9.77a and b; the contour lines are drawn through points having the indicated dose rates at 12 hours after the detonation time. Figure 9.77a refers to the BOLTZMANN shot (12 kilotons, 500- foot tower) of May 28, 1957 and Fig. 9.77b to the TURK shot (43 kilotons, 500-foot tower) of March 7, 1955. Because of the difference in wind conditions, the fallout patterns are quite different. Furthermore, attention should be drawn to the hot spot, some 60 miles NNW of the northern boundary of the Nevada Test Site, that was observed in connection with the BOLTZMANN test. This area was found to be seven times more radioactive than its immediate surroundings. The location was directly downwind of a mountain range and rain was reported in the general vicinity at the time the fallout occurred. Either or both of these factors may have been responsible for the increased radioactivity.
9.78 Measurement of fallout activity from megaton-yield weapons in the Pacific Ocean area has indicated the presence of marked irregularities in the overall pattern. Some of these may have been due to the difficulties involved in collecting and processing the limited data. Nevertheless, there is evidence to indicate that a hot spot some distance (50 to 75 miles) downwind of the burst point may be typical of the detonations at the Eniwetok Proving Grounds and, in fact, some fallout prediction methods have been designed to reproduce this feature. The occurrence of these hot spots may have been a consequence of the particular wind structure (§ 9.66). The times for most explosions at the Eniwetok Proving Grounds coincided with complex wind structures from the altitude of the stabilized cloud to the surface. The large directional changes in the wind served to contain the fallout more locally than if the wind were blowing in one direction.
FALLOUT PREDICTIONS FOR LAND SURFACE BURSTS
PREDICTION OF FALLOUT PATTERNS
9.79 Several methods, of varying degree of complexity, have been developed for predicting dose rates and integrated (total) doses resulting from fall out at various distances from ground (or surface) zero. These methods fall into four general categories; they are, in decreasing order of complexity, and hence detail, the mathematical fallout model, the analog method, the danger sector forecast, and the idealized fallout pattern. Each of these techniques requires, of course, a knowledge of the total and fission yields of the explosion, the burst height, and the wind structure to the top of the radioactive cloud in the vicinity of the burst. The more complex procedures require a forecast of the winds and weather in the locality over a period of several hours to a few days after the explosion. In making these forecasts, the considerable seasonal variations in wind patterns must be kept in mind.
9.80 In the fallout model method, an attempt is made to describe fallout mathematically and, with various inherent assumptions, to predict the dose-rate distribution contours resulting from a particular situation. The most reliable procedures are very complex and require use of a large digital computer in their application to a variety of circumstances. They are, consequently, employed primarily in theoretical studies of the fallout process, in making planning estimates, and in the preparation of templates for use with analog prediction methods. Apart from a few instances, less detailed mathematical models, which do not require digital computers, have been used to predict fallout distribution patterns during nuclear tests.
9.81 The analog technique, which is essentially a comparison process, utilizes a pattern chosen from a catalog of fallout contour patterns covering a wide range of yields and wind conditions. The choice is determined by the similarity between the yield and wind in the given situation and those in the catalog pattern. The catalog can consist of actual fallout patterns and others interpolated and extrapolated from these, or of patterns obtained by calculation from a mathematical fallout model.
9.82 The danger sector forecast requires a minimum of detailed information in order to give a qualitative picture of the general fallout area and an idea of the arrival times. Although it provides a rough indication of the relative degree of hazard, there is little or no information concerning the actual dose rates to be expected at various locations. The method yields a prediction quickly and simply and is probably as accurate as the explosion yield and meteorological information will justify in an operational (field) situation. The fourth prediction method, based on the use of idealized fallout distribution patterns, is described in some detail below. Such idealized patterns are derived from a detailed mathematical model, as described in § 9.80, based on average or most probable conditions.
IDEALIZED FALLOUT PATTERNS
9.83 Idealized fallout contour patterns have been developed which represent the average fallout field for a given yield and wind condition. No attempt is made to indicate irregularities which will undoubtedly occur in a real fallout pattern, because the conditions determining such irregularities are highly variable and uncertain. Nevertheless, in spite of their limitations, idealized patterns are useful for planning purposes, for example in estimating the overall effect of fallout from a large-scale nuclear attack. Although they will undoubtedly underestimate the fallout in some locations and overestimate it in others, the evaluation of the gross fall out problem over the whole area affected should not be greatly in error.
9.84 For a detailed fallout distribution prediction, the winds from the surface to all levels in the radioactive cloud must be considered. However, for the idealized patterns, the actual complex wind system is replaced by an approximately equivalent “effective wind.” Various methods have been used to define the effective wind, i.e., speed and direction, for the generation of idealized patterns. The effective wind that is appropriate for use with the idealized patterns described below should be obtained by first determining the average wind from the ground to the base and to the top of the stabilized cloud (§ 2.15). The effective wind is then the mean of these two average winds.
9.85 By assuming little or no wind shear, that is, essentially no change in wind direction at different altitudes, the idealized fallout contour patterns have a regular cigar-like shape, as will be seen shortly. But if the wind direction changes with altitude, the fallout will spread over a wider angle, as in Fig. 9.77a, and the activity, i.e., the radiation dose rate, at a given distance from ground (or surface) zero will be decreased because the same amount of radioactive contamination will cover a larger area. Lower wind speeds will make the pattern shorter in the downwind direction because the particles will not travel so far before descending to earth; the activity at some distance from the burst point will be lower and the high dose rates immediately downwind of ground zero will be increased. If the wind speed is higher, the contaminated area will be greater, and the radioactivity will be higher at large distances from surface zero and lower immediately downwind of ground zero.
DEVELOPMENT OF FALLOUT PATTERN
9.86 Before showing an idealized fallout distribution pattern it is important to understand how such a pattern develops over a large area during a period of several hours following a surface burst. The situation will be illustrated by the diagrams in Figs. 9.86a and b, which apply to a 2-megaton explosion with 50 percent fission yield. The effective wind speed was taken as 15 miles per hour. Fig. 9.86a shows a number of contour lines for certain (arbitrary) round-number values of the dose rate, as would be observed on the ground, at 1, 6, and 18 hours, respectively, after the explosion. A series of total (or accumulated) dose contour lines for the same times are given in Fig. 9.86b. It will be understood, of course, that the various dose rates and doses change gradually from one contour line to the next. Similarly, the last contour line shown does not represent the limit of the contamination, since the dose rate (and dose) will continue to fall off over a greater distance.
9.87 Consider, first, a location about 20 miles directly downwind from ground zero. At 1 hour after the detonation, the observed dose rate is seen to be roughly 3 rads/hr but it will rise rapidly and will reach a value over 500 rads/hr sometime between 1 and 2 hours. The dose rate will then decrease to about 200 rads/hr at 6 hours; at 18 hours it is down to roughly 50 rads/hr. The increase in dose rate after 1 hour means that at the specified location the fallout was not complete at that time. The subsequent decrease after about 2 hours is then due to the natural decay of the fission products. Turning to Fig. 9.86b, it is seen that the total radiation dose received at the given location by 1 hour after the explosion is small, because the fallout has only just started to arrive. By 6 hours, the total dose has reached more than 1,000 rads and by 18 hours a total dose of some 2,000 rads will have been accumulated. Subsequently, the total dose will continue to increase, toward the infinite time value, but at a slow rate (see Table 9.22).
9.88 Next, consider a point 100 miles downwind from ground zero. At 1 hour after the explosion the dose rate, as indicated in Fig. 9.86a, is zero, since the fallout will not have reached the specified location. At 6 hours, the dose rate is about 1 rad per hour and at 18 hours about 5 rads per hour. The fallout commences at somewhat more than 6 hours after the detonation and it is essentially complete at 9 hours, although this cannot be determined directly from the contours given. The total accumulated dose, from Fig. 9.86b, is seen to be zero at 1 hour after the explosion, less than 1 rad at 6 hours, and about 80 rad at 18 hours. The total (infinite time) dose will not be as great as at locations closer to ground zero, because the quantity of fission products reaching the ground decreases at increasing distances from the explosion.
9.89 In general, therefore, at any given location at a distance from a surface burst, some time will elapse between the explosion and the arrival of the fallout. This time will depend on the distance from ground zero and the effective wind velocity. When the fallout first arrives, the dose rate is small, but it increases as more and more fallout descends. After the fallout is complete, the radioactive decay of the fission products will cause the dose rate to decrease. Until the fallout commences, the accumulated dose will, of course, be small, but after its arrival the total accumulated radiation dose will increase continuously, at first rapidly and then somewhat more slowly, over a long period of time, extending for many months and even years.
9.90 The curves in Figs. 9.90a and b illustrate this behavior qualitatively; they show the variation with time of the dose rate and the accumulated dose from fallout at points near and far, respectively, in the downwind direction from a surface burst. Both the dose rate and the dose are zero until the fallout particles reach the given locations. At these times the dose rate commences to increase, reaches a maximum, and subsequently decreases, rapidly at first as the radio isotopes of short half-life decay, and then more slowly. The total accumulated dose increases continuously from the time of arrival of the fallout toward the limiting (infinite time) value.
9.91 Since the mushroom cloud grows rapidly in radius and reaches its stabilized altitude before the winds can act on it significantly, the time of arrival of the fallout at a particular location is measured by the distance from the portion of the cloud nearest to that location and the speed of the effective wind. The time of arrival is equal to the distance from ground zero to the point of interest minus the radius of the cloud, divided by the effective wind speed. For the present purpose the radius of the stabilized cloud as a function of yield may be obtained from Fig. 2.16. The radius is affected to some extent by the properties of the atmosphere, in particular by the height of the tropopause. The curve in Fig. 2.16 represents a reasonable average for mid-latitudes. The radius of the stabilized cloud is only important in calculating the time of arrival for locations relatively close to ground zero and for large-yield weapons. If the cloud radius is small in comparison with the distance from ground zero to the point of interest, e.g., for low yields or large distances, the cloud radius may be neglected in calculating fallout arrival times.
UNIT-TIME REFERENCE DOSE RATE
9.92 The representation of dose rate and accumulated dose curves, of the form of Figs. 9.86a and b, for all times following a nuclear detonation would obviously be a highly complicated matter. Fortunately, the situation can be simplified by utilizing an idealized fall out pattern in terms of the unit-time reference dose rate, mentioned in § 9.16 et seq. By means of the curves given earlier in the chapter (Figs. 9.16a and b and Fig. 9.20) it is then possible to estimate dose rates and total doses from fallout at any given time for a specified distance downwind from the burst point. The calculations are valid only if all the early fallout has descended at that time.
9.93 The general form of the idealized unit-time reference dose-rate contours for land surface bursts is shown in Fig. 9.93. The dimensions that define the various contours are indicated for the 1-rad per hour contour. In a real situation all contour lines would be closed in the upwind direction as shown for the 1-rad per hour contour. The scaling relationships, for calculating the downwind distance, the maximum width, the ground-zero width of the idealized unit-time dose-rate contours for contact surface bursts (§ 2.127 footnote) of W kilotons yield are summarized in Table 9.93. The effective wind is 15 miles per hour in each case with wind shear of 15°. The upwind distance depends on the cloud radius; it is estimated to be approximately one half the ground-zero width, i.e., the upwind contours may be represented roughly by semi circles centered at ground zero. The contour scaling relationships are dependent upon the nature of the surface; the values in Table 9.93 are applicable to most surface materials in the continental United States (cf. § 9.63).
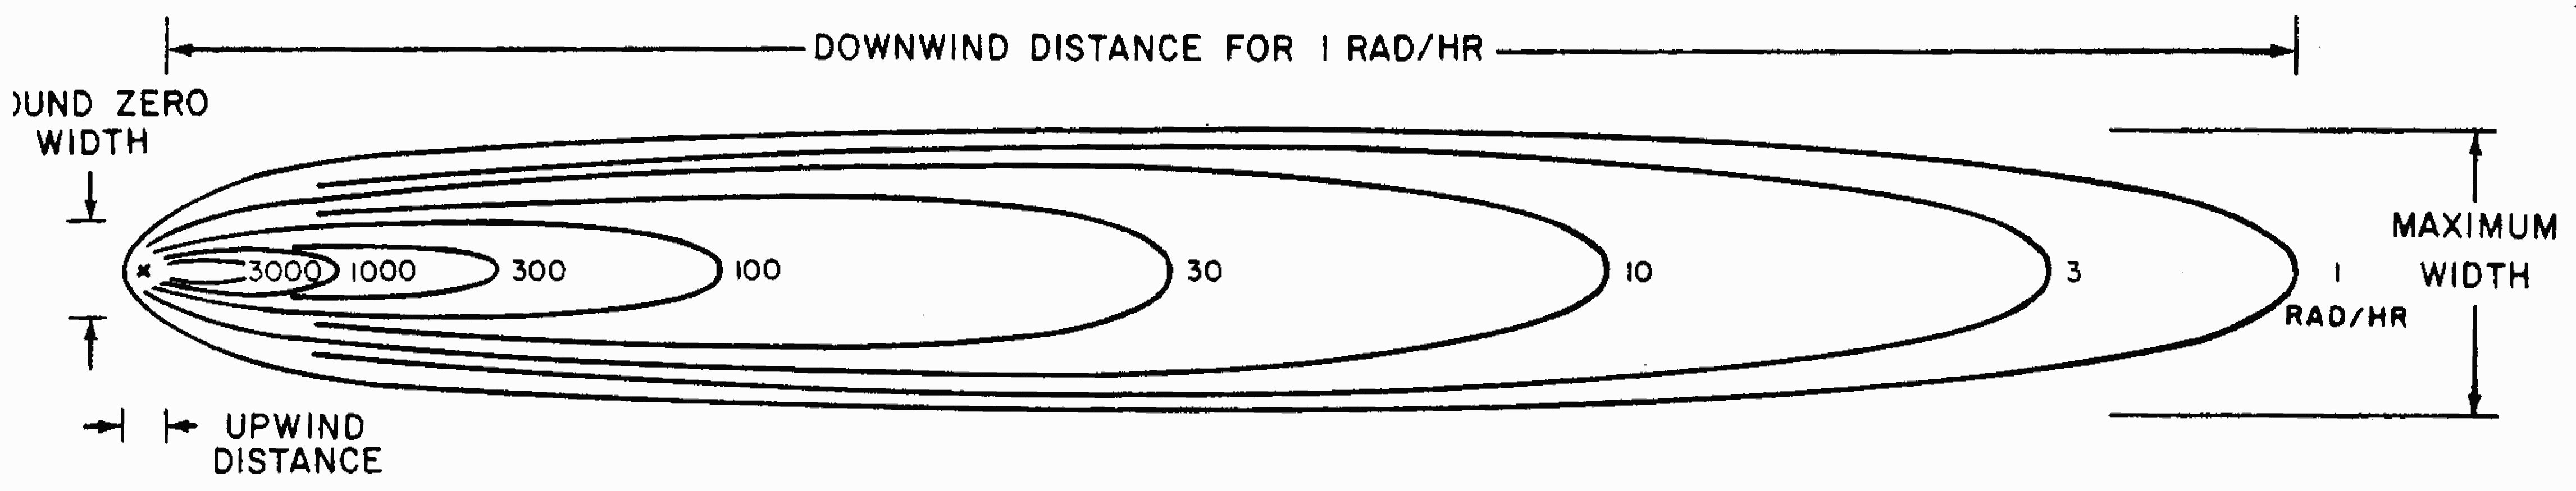
| Reference dose rate (rads/hr) | Downwind distance (statute miles) | Maximum width (statute miles) | Ground zero width (statute miles) |
|---|---|---|---|
| 3,000 | 0.95 W0.45 | 0.0076 W0.86 | 0.026 W0.58 |
| 1,000 | 1.8 W0.45 | 0.036 W0.76 | 0.060 W0.57 |
| 300 | 4.5 W0.45 | 0.13 W0.66 | 0.20 W0.48 |
| 100 | 8.9 W0.45 | 0.38 W0.60 | 0.39 W0.42 |
| 30 | 16 W0.45 | 0.76 W0.56 | 0.53 W0.41 |
| 10 | 24 W0.45 | 1.4 W0.53 | 0.68 W0.41 |
| 3 | 30 W0.45 | 2.2 W0.50 | 0.89 W0.41 |
| 1 | 40 W0.45 | 3.3 W0.48 | 1.5 W0.41 |
9.94 Idealized contour shapes and sizes are a function of the total yield of the weapon, whereas the dose-rate contour values are determined by the fission yield. Thus, in order to obtain idealized fallout patterns for a weapon that does not derive all of its yield from fission, the dose-rate values of the contour lines for a weapon of the same total yield should be multiplied by the ratio of the fission yield to the total yield. For example, for a weapon having a total yield of W kilotons with 50 percent of the energy derived from fission, the contour dimensions are first determined from Table 9.93 for a yield of W kilotons. The unit-time reference dose rates are then multiplied by 0.5. Except for isolated points in the immediate vicinity of ground zero, observations indicate that unit-time reference dose rates greater any event, the locations of such high reference values will be within the areas of complete devastation from other effects.
9.95 The idealized reference dose rates obtained by the methods described above apply to doses that would be received in the open over a completely smooth surface. Such surfaces provide a convenient reference for calculations, but they do not occur to any great extent in nature. Even the surface roughness in relatively level terrain will make the actual values smaller than the idealized values. A reduction (or terrain shield ing) factor of about 0.7 is appropriate under such circumstances. A reduction factor of 0.5 to 0.6 would be more suitable for rough, hilly terrain. Any shelter would decrease the dose received from early fallout(§ 9.120).
SCALING FOR EFFECTIVE WIND
9.96 The effective wind speed and direction vary with the heights of the top and bottom of the stabilized cloud (§ 9.84). For a weapon of given yield, these heights will depend upon many factors, including the density and relative humidity of the atmosphere and the altitude of the tropopause. Nevertheless, within the accuracy of the idealized unit-time reference dose-rate contours: approximate values of the cloud heights may be used. The curves in Fig. 9.96 are based on the same model as was used in deriving the dose-rate contours and scaling relationships in § 9.93. They may be taken to be representative of the average altitudes to which nuclear clouds from surface (or low air) bursts of various yields might be expected to rise in the mid-latitudes, e.g., over the United States.
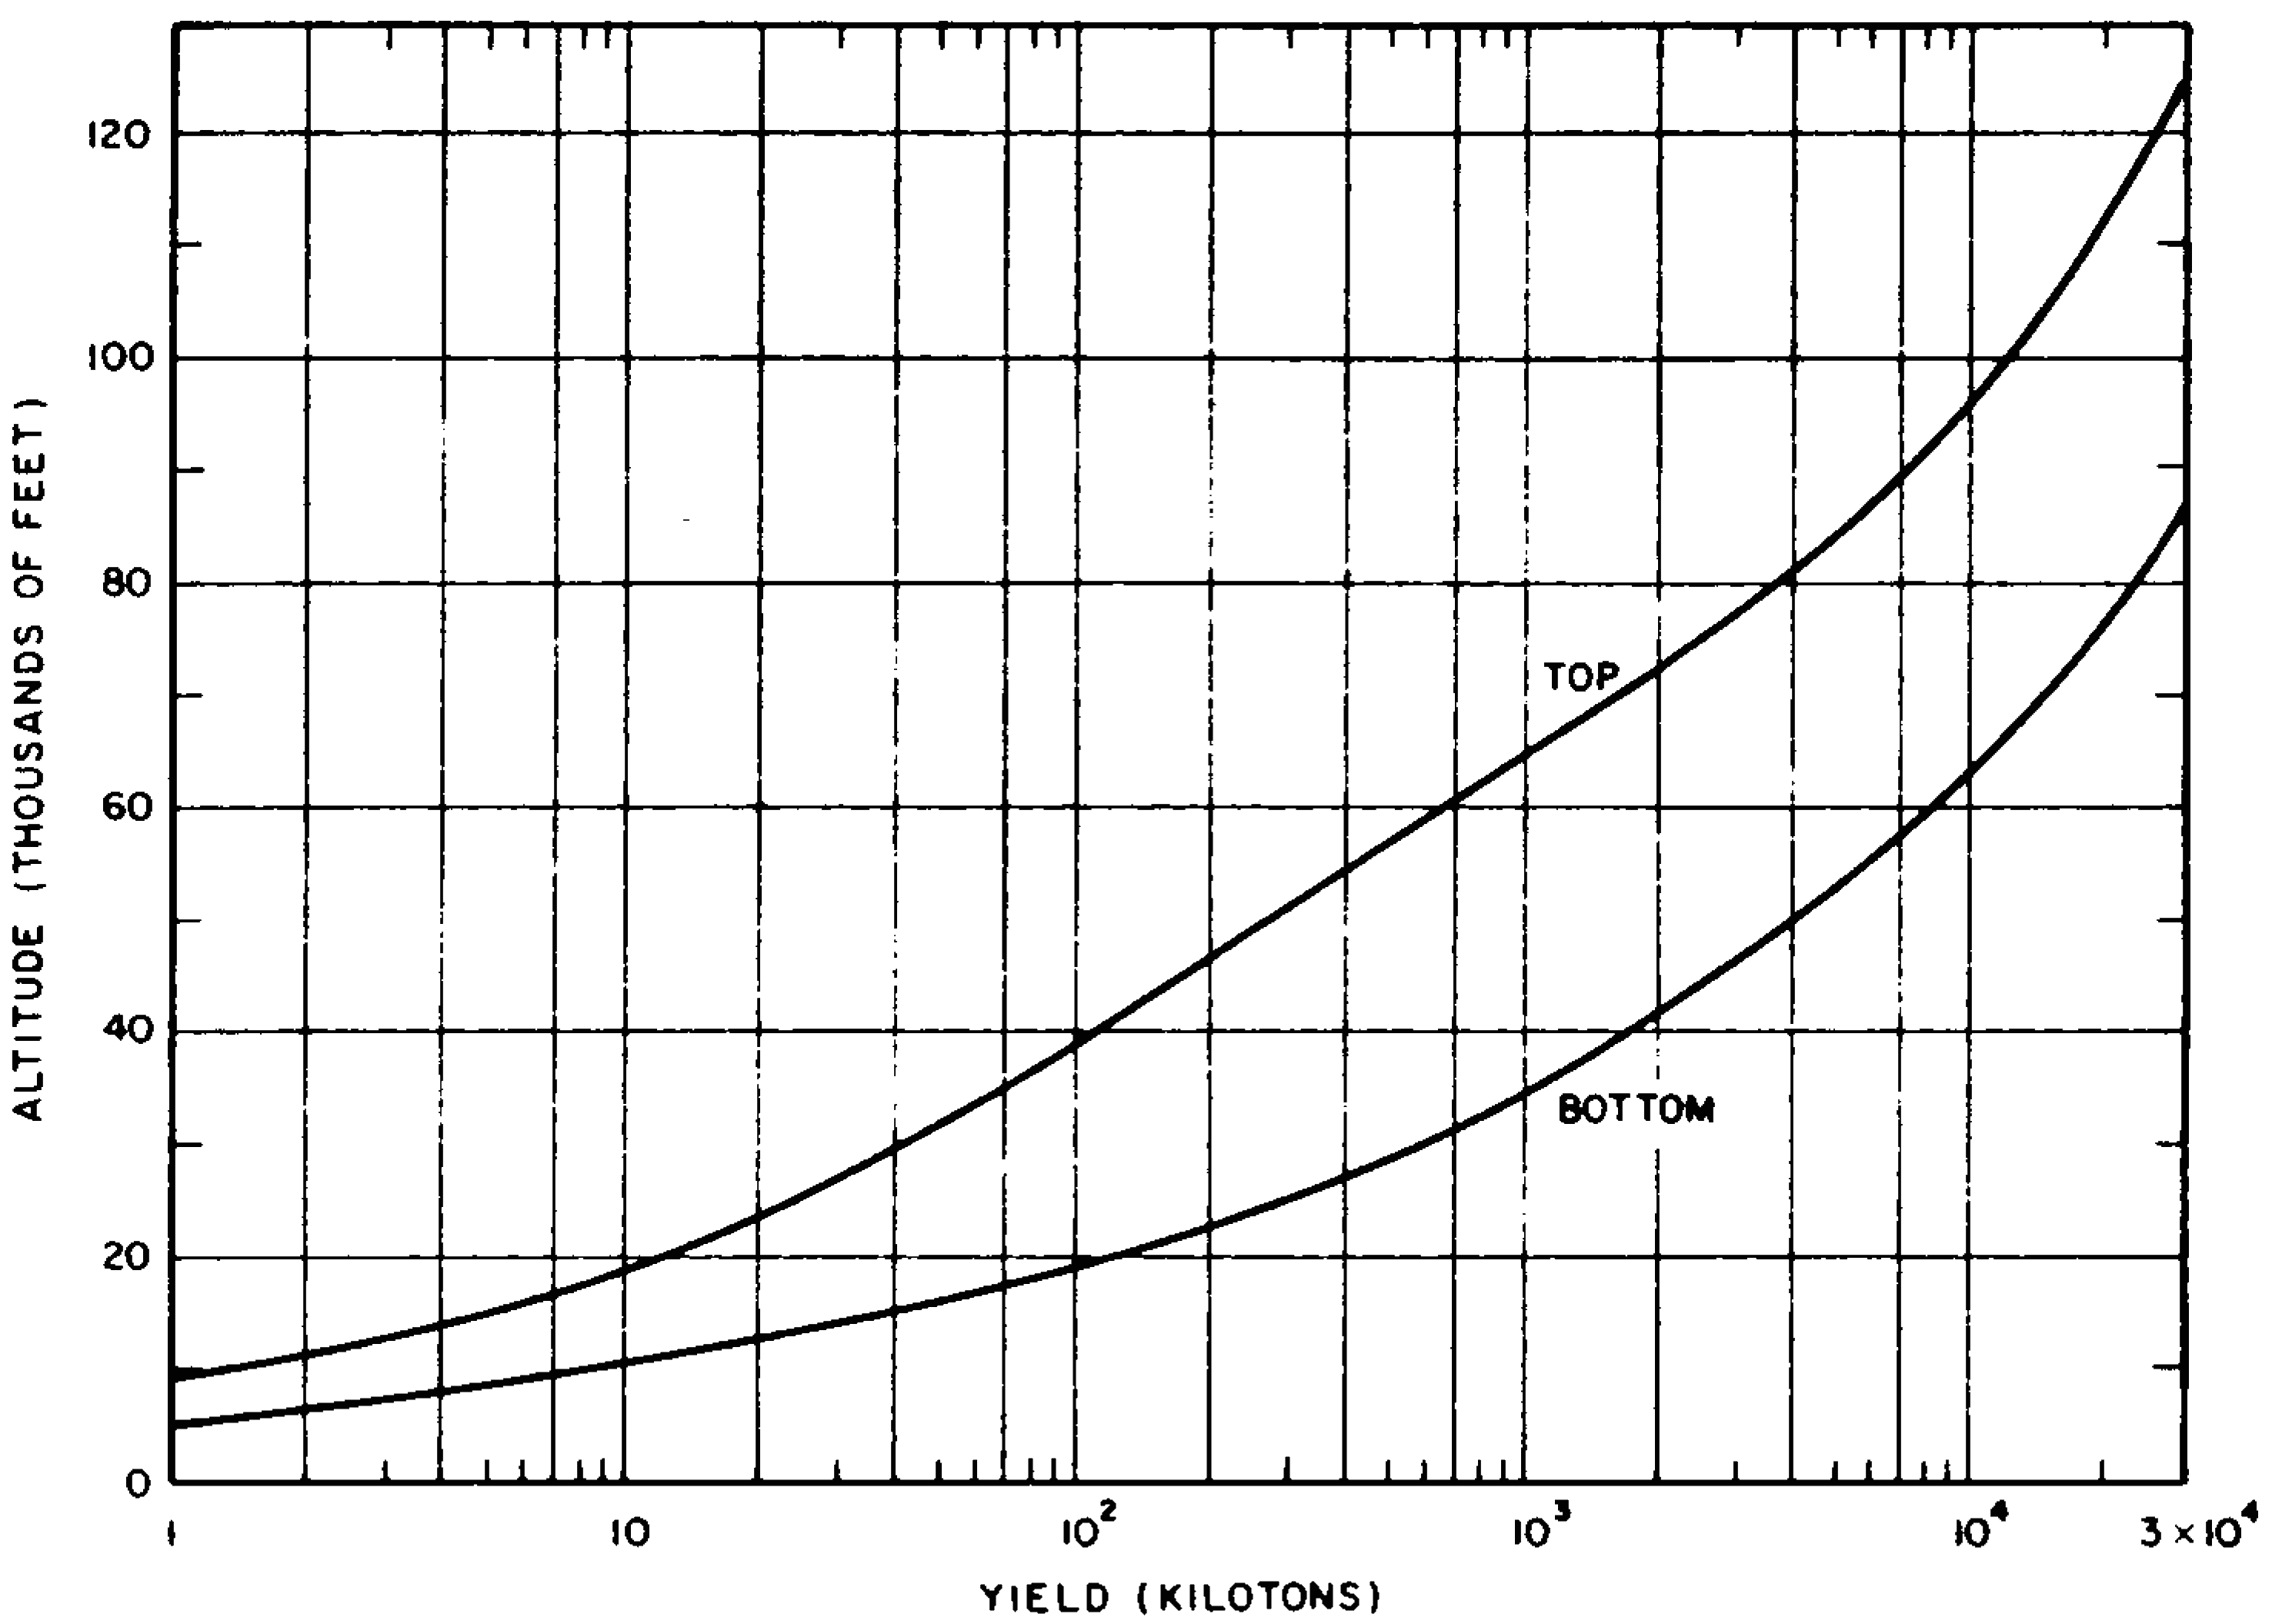
9.97 If there is no directional shear, then doubling the effective wind speed would cause the particles of a given size that originate at a particular location within the cloud to reach the ground at twice the distance from ground zero, so that they are spread over roughly twice the area. However, particles of many different sizes will arrive at any given point on the ground as a result of the different travel times from different points of origin in the large nuclear cloud. Consequently, simple scaling relationships for wind speed are not possible. Examination of test data and the results of calculations with computer codes suggest the following approximate scaling procedure: for effective wind speeds of $v$ miles per hour, the downwind distances derived from Table 9.93 are multiplied by the factor $F$, where
\[ F = 1 + \frac{v - 15}{60} \]for effective wind speeds greater than 15 miles per hour, and
\[ F = 1 + \frac{v - 15}{30} \]for wind speeds less than 15 miles per hour. These relations hold reasonably well for simple wind structures, i.e., for winds with very little directional shear, and for effective wind speeds between about 8 and 45 miles per hour. As defined in § 9.84, effective winds with speeds greater than 45 miles per hour are not common, and speeds less than 8 miles per hour generally result from large changes in directional wind shear with increasing altitude. The fallout patterns would then be too complex to be represented by idealized dose-rate contours.
9.98 As the downwind distance for a given unit-time reference dose-rate contour increases with increasing wind speed, the maximum width of that con tour will decrease somewhat. Conversely, a decrease in downwind distance of a given contour with decreasing wind speed will be accompanied by an increase in maximum width of that contour. For an increase in wind speed, within the limits of the simple wind structures and wind speeds for which the idealized contours apply, the changes in maximum width of a given contour will be small, and wind scaling may be ignored. This may also be done for the upwind distances and hence for the ground-zero widths. An increase in the wind speed will tend to decrease upwind distances by causing the particles to drift toward ground zero as they fall. At the lower 1-hour reference dose rates, e.g., 100 rads/hr or less, the upwind distances will in fact decrease with increasing wind speed. However, the larger particles, which are mainly responsible for the close-in high dose rates, descend very quickly and the high dose-rate contours will not be greatly affected by the wind speed. Consequently, since simple wind scaling is not possible and the upwind distances are relatively short, a conservative approach is to assume that wind speed has no effect on upwind distances (and ground-zero widths).
LIMITATIONS OF IDEALIZED CONTOURS
9.99 Both the idealized 15-mile per hour pattern dimensions and the wind scaling procedure tend to maximize the downwind extent of the dose-rate contours since they involve the postulate that there is little wind shear. This is not an unreasonable assumption for the continental United States, since the wind shear is generally small at altitudes of interest from the standpoint of fall out. If there is a greater wind shear, e.g., 20° or more between the top and bottom of the mushroom head, the fall out pattern would be wider and shorter than that based on Table 9.93. The actual unit-time reference dose rate at a specified downwind distance from ground zero for a given effective wind speed would then be smaller than predicted. The crosswind values at certain distances would, however, be increased. In some cases of extreme shear the pattern will extend from ground zero in two or more directions. In these cases, it is impossible to define a down wind direction, and idealized contours are of little value in describing the shape of the pattern (cf. Fig. 9.77b).
9.100 In order to emphasize the limitations of the idealized fallout patterns, Figs. 9.100a and b are presented here. The former shows the idealized unit-time reference dose-rate contours for a 10-megaton, 50-percent fission surface burst and an effective wind speed of 30 miles per hour. In Fig. 9.100b an attempt is made to indicate what the actual situation might be like as a result of variations in local meteorological and surface conditions. Near ground zero the wind is from the south west but the mean wind gradually changes to a westerly and then a northwesterly direction over a distance of a few hundred miles. These changes in the mean wind are reflected in Fig. 9.100b, but, since the idealized pattern is based on a single effective wind, the changes in the mean wind do not affect Fig. 9.100a. The total contamination of the area is about the same in both cases, but the details of the distribution, e.g., the occurrence of hot spots, which are shown shaded in Fig. 9.100b, is quite different. The pattern in Fig. 9.100b is hypothetical and not based on actual observations; its purpose is to call attention to the defects of the idealized fallout pattern. But since the factors causing deviations from the ideal vary from place to place and even from day to day, it is impossible to know them in advance. Consequently, the best that can be done here is to give an idealized pattern and show how it may be used to provide an overall picture of the contamination while, at the same time, indicating that in an actual situation there may be marked differences in the details of the distribution.
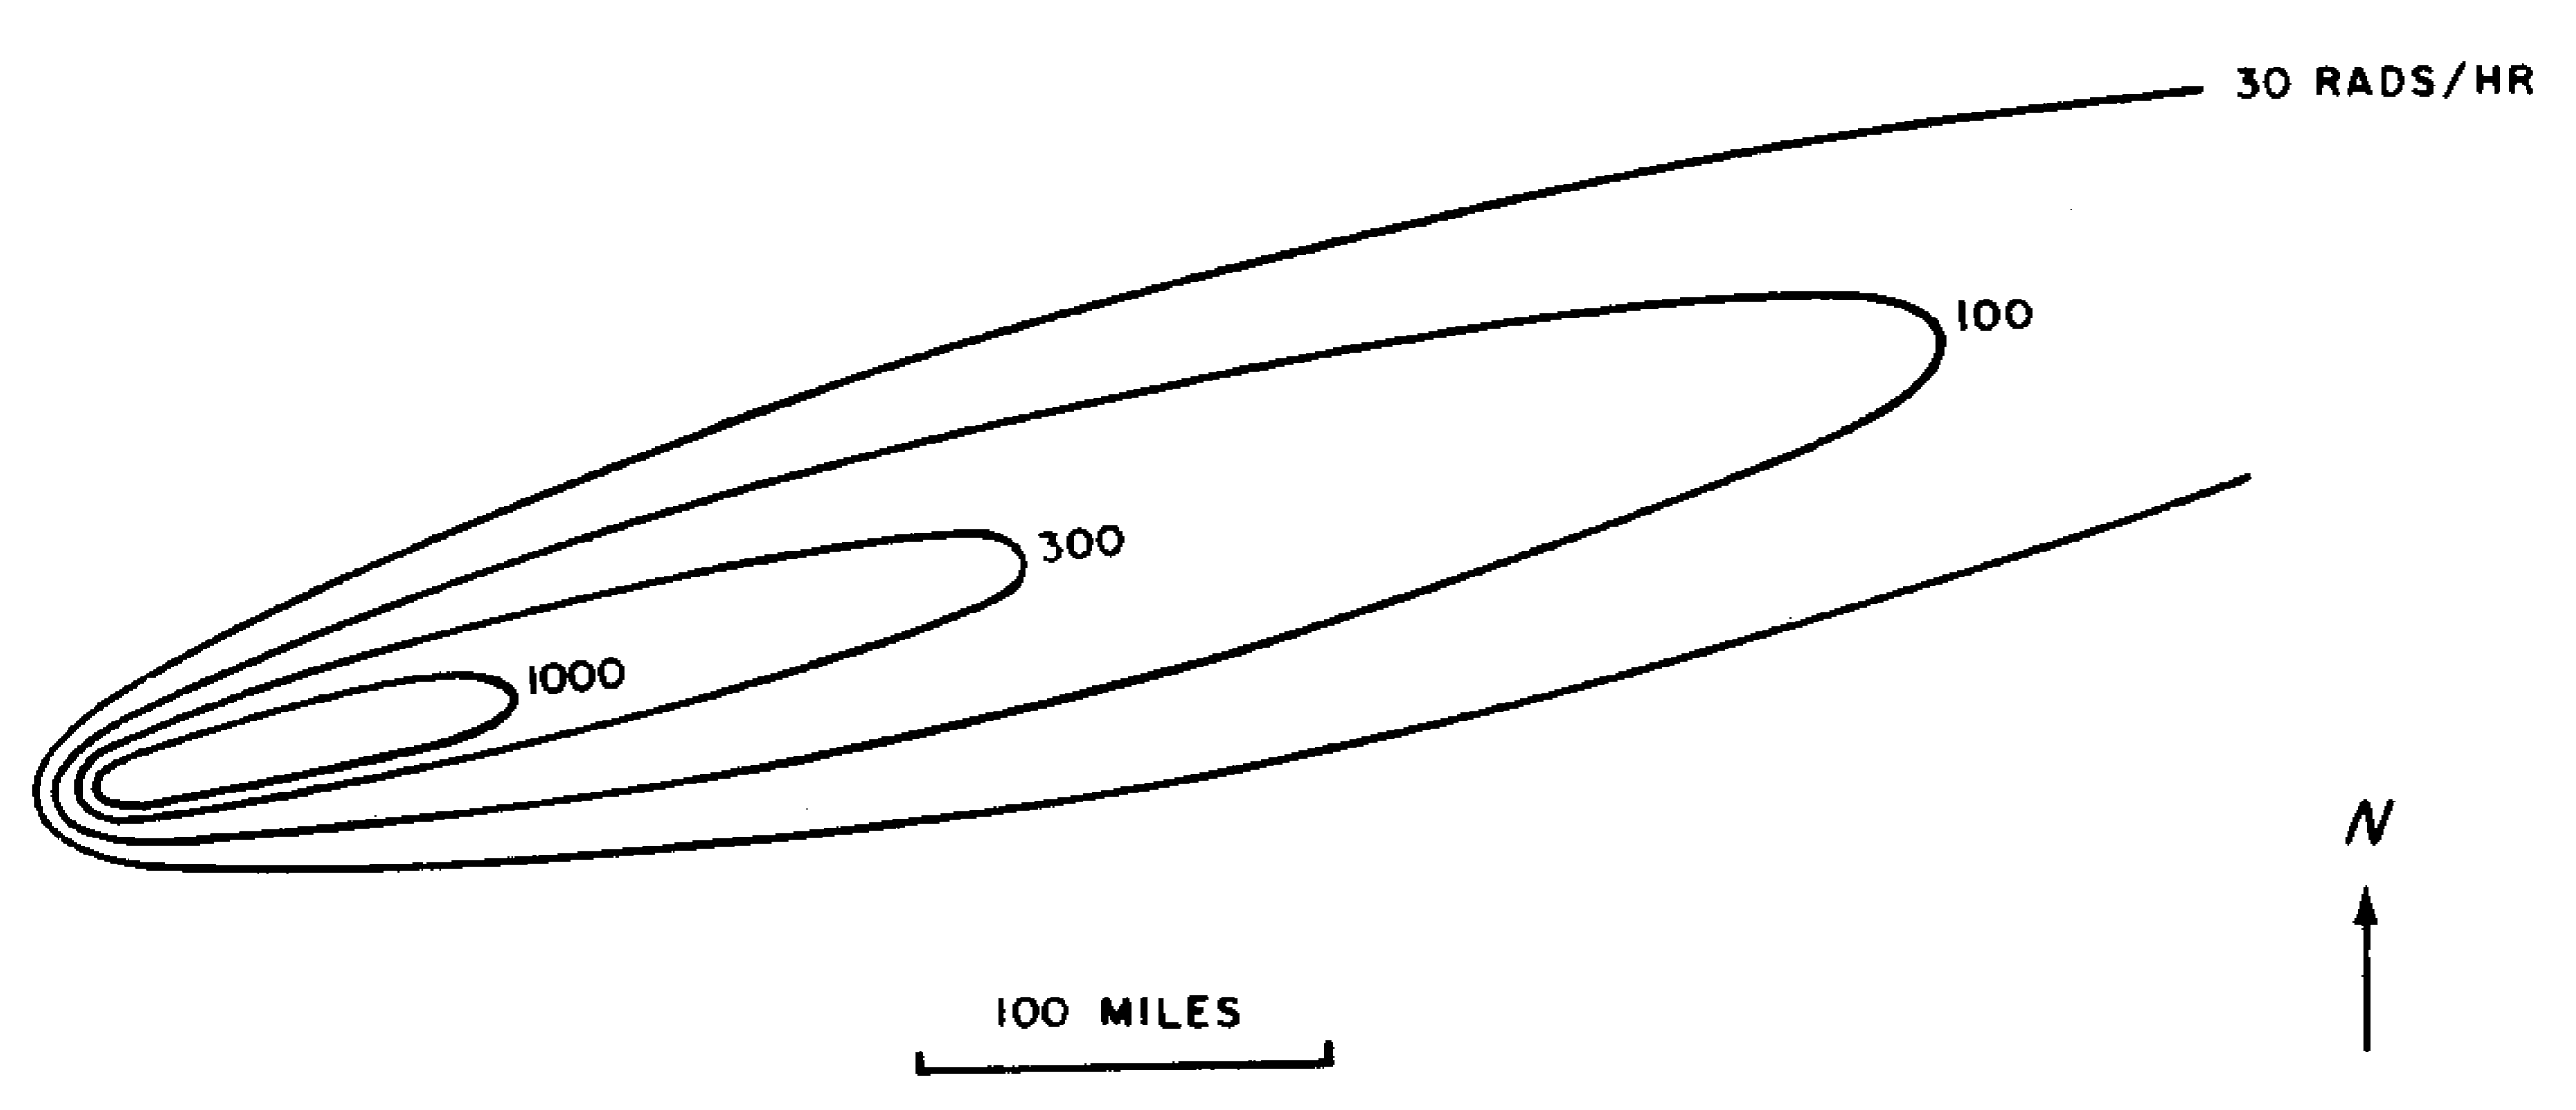
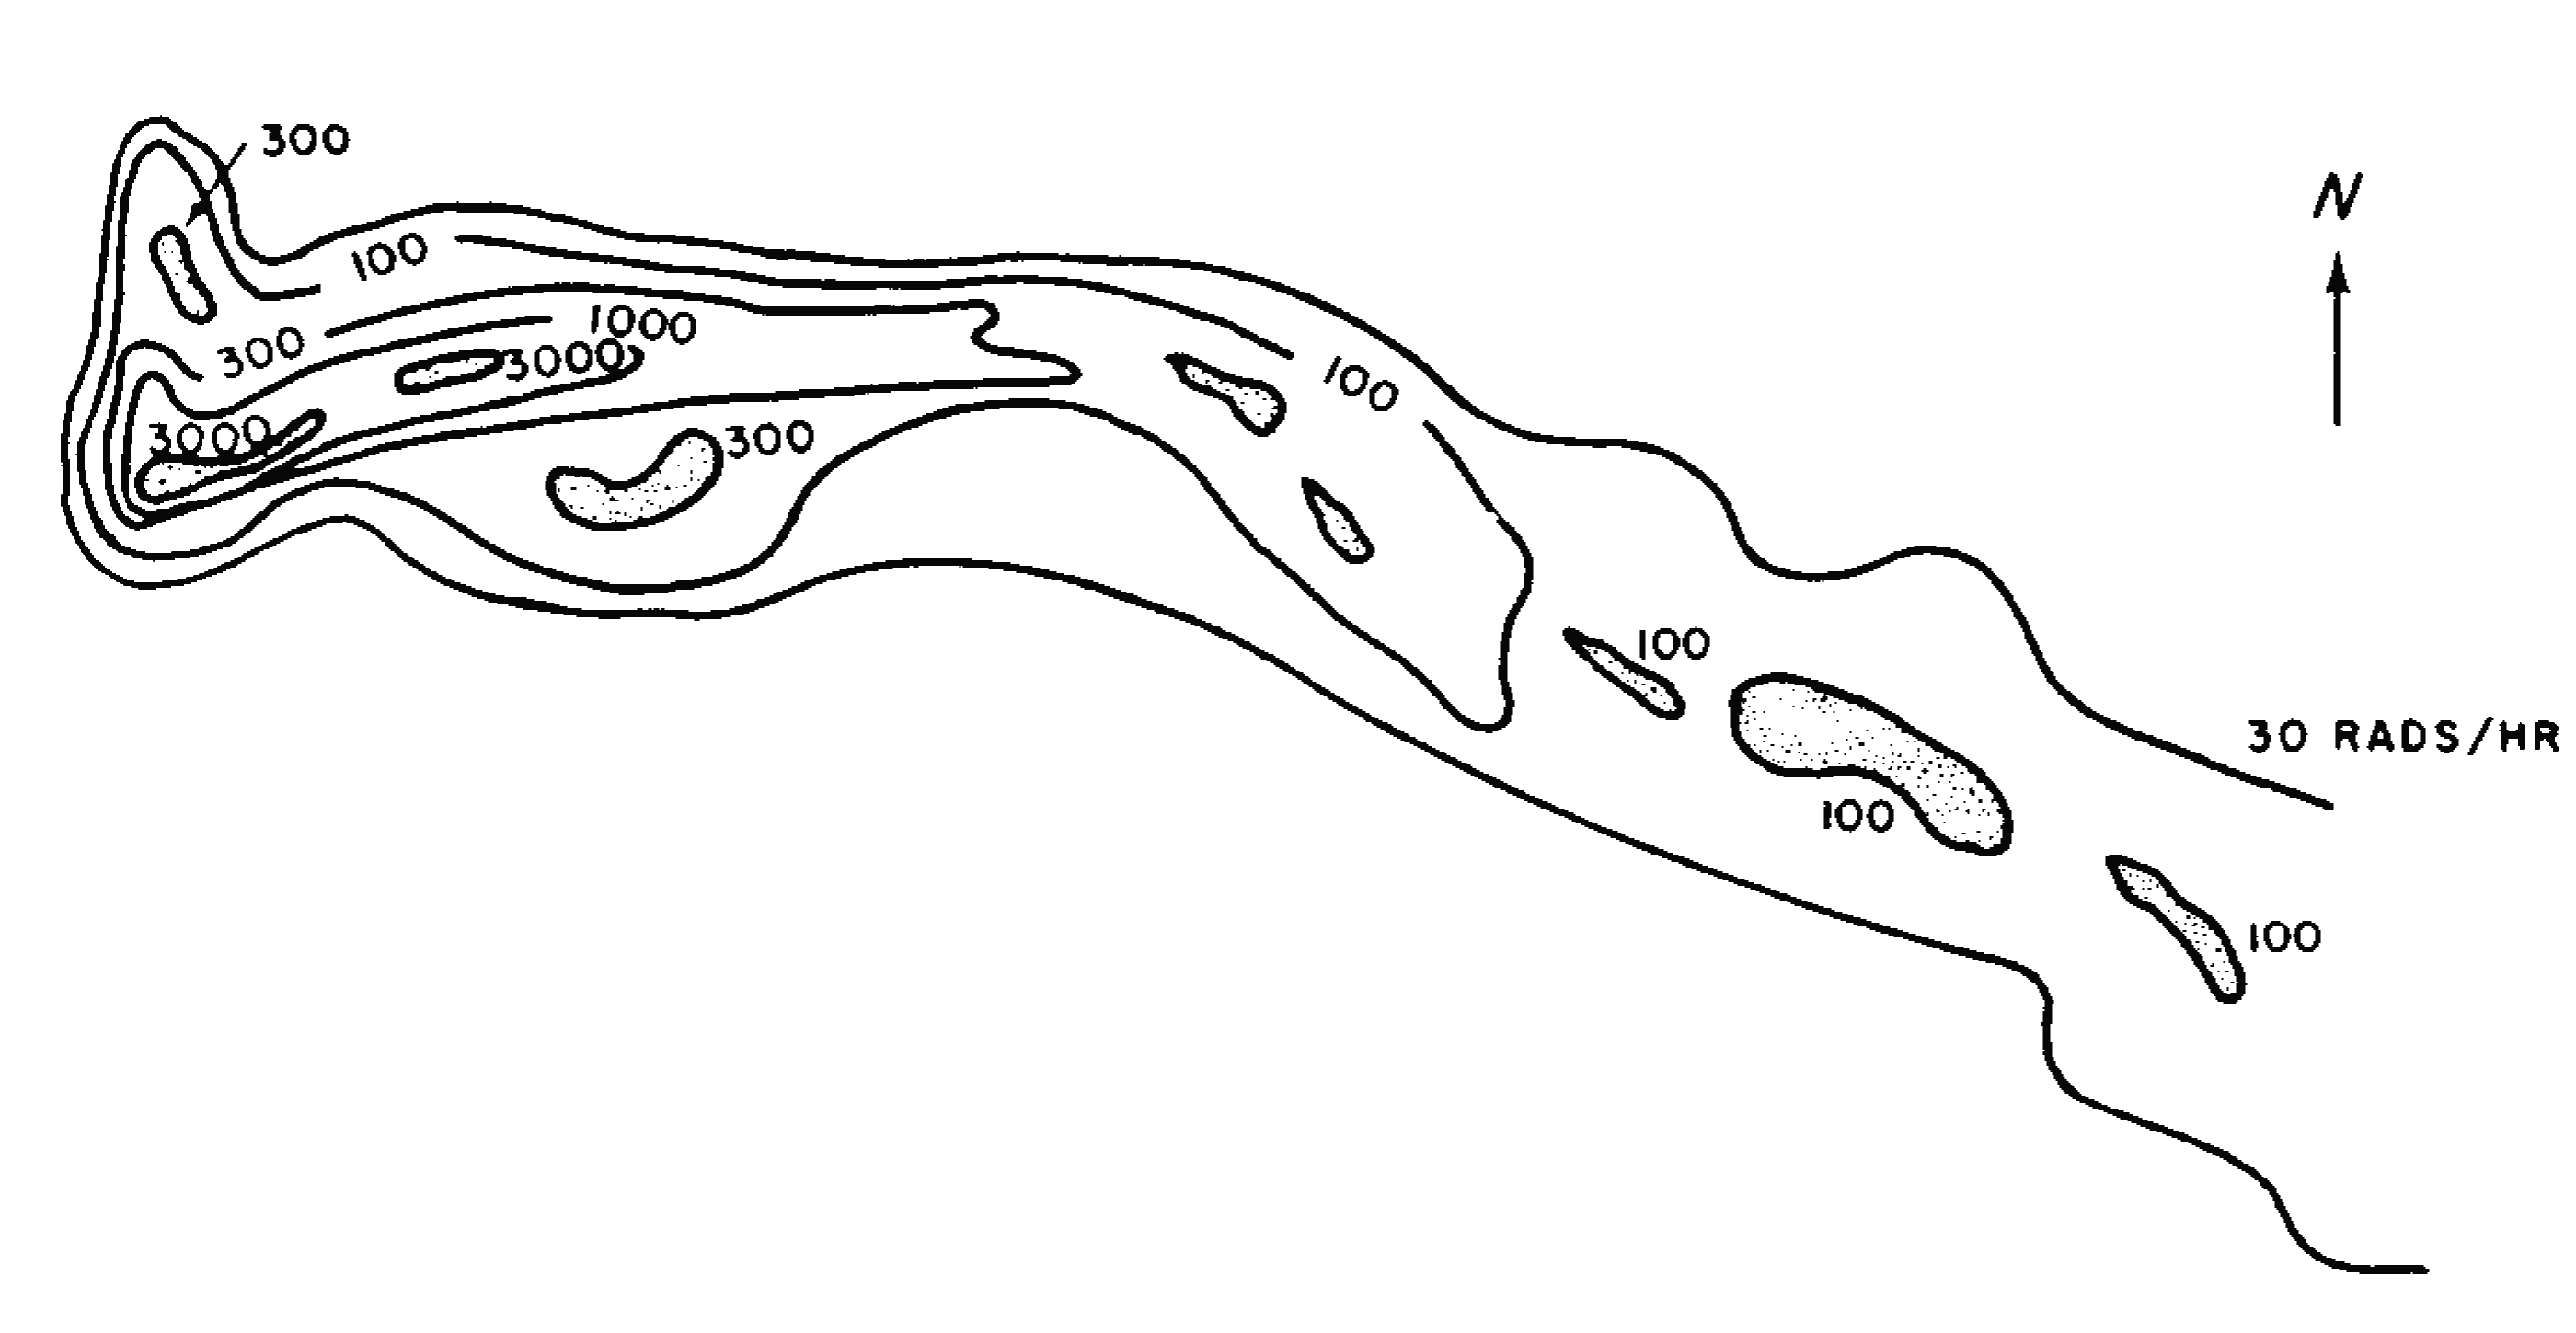
FACTORS AFFECTING FALLOUT PATTERNS
9.101 It must be emphasized that the procedures described above for developing idealized fallout patterns are intended only for overall planning. There are several factors which will affect the details of the distribution of the early fallout and also the rate of decrease of the radioactivity. Near ground zero, activity induced by neutrons in the soil may be significant, apart from that due to the fallout. However, the extent of the induced activity is very variable and difficult to estimate (§ 9.49). The existence of unpredictable hot spots will also affect the local radiation intensity. Furthermore, precipitation scavenging will have an important effect on the fallout pattern(§ 9.67 et seq.). The data presented in the preceding paragraphs are applicable to very smooth surfaces of large size. As mentioned in § 9.95, even ground roughness in what would normally be considered flat countryside might reduce the dose rates to about 70 percent of those predicted for a smooth surface. In a city, buildings, trees, etc., will reduce the average intensity still further.
9.102 The rate of decay of the early fallout radioactivity, and hence the total dose accumulated over a period of time, will be affected by weathering. Wind may transfer the fallout from one location to another, thus causing local variations. Rain, after the fallout has descended, may wash the particles into the soil and this will tend to decrease the dose rate observed above the ground. The extent of the decrease will, of course, depend on the climatic and surface conditions. In temperate regions in the absence of rain, the weathering effect will probably be small during the first month after the explosion, but over a period of years the fallout dose rate would decrease to about half that which would otherwise be expected.
9.103 In attempting to predict the time that must elapse, after a nuclear explosion, for the radiation dose rate to decrease to a level that will permit re entry of a city or the resumption of agricultural operations, use may be made of the (continuous) decay curves in Figs. 9. 16a and b or of equivalent data. It is inadvisable, however, to depend entirely on these estimates because of the uncertainties mentioned above. Moreover, even if the decay curve could be relied upon completely, which is by no means certain, the actual composition of the fallout is known to vary with distance from ground zero (§ 9.08) and the decay rate will vary accordingly. At 3 months after a nuclear explosion, the dose rate will have fallen to about 0.01 percent, i.e., one ten-thousandth part, of its value at 1 hour, so that almost any contaminated areas will be safe enough to enter for the purposes of taking a measurement with a dose-rate meter, provided there has been no additional contamination in the interim.
THE HIGH-YIELD EXPLOSION OF MARCH 1, 1954
9.104 The foregoing discussion of the distribution of the early fallout may be supplemented by a description of the observations made of the contamination of the Marshall Islands area following the high-yield test explosion (BRAVO) at Bikini Atoll on March 1, 1954. The total yield of this explosion was approximately 15-megatons TNT equivalent. The device was detonated about 7 feet above the surface of a coral reef and the resulting fallout, consisting of radioactive particles ranging from about one-thousandth to one-fiftieth of an inch in diameter, contaminated an elongated area extending over 330 (statute) miles downwind and varying in width up to over 60 miles. In addition, there was a severely contaminated region upwind extending some 20 miles from the point of detonation. A total area of over 7,000 square miles was contaminated to such an extent that avoidance of death or radiation injury would have depended upon evacuation of the area or taking protective measures.
9.105 The available data, for the estimated total doses accumulated at various locations by 96 hours after the BRAVO explosion, are shown by the points in Fig. 9.105. Through these points there have been drawn a series of contour lines which appear to be in moderately good agreement with the data. However, other patterns are possible; one, for example, ascribes the large radiation doses on the northern islands of Rongelap Atoll to a hot spot and brings the 3,000-rad contour line in much closer to Bikini Atoll. Because of the absence of observations from large areas of ocean, the choice of the fallout pattern, such as the one in Fig. 9.105, is largely a matter of guesswork. Nevertheless, one fact is certain: there was appreciable radioactive contamination at distances downwind of 300 miles or more from the explosion.
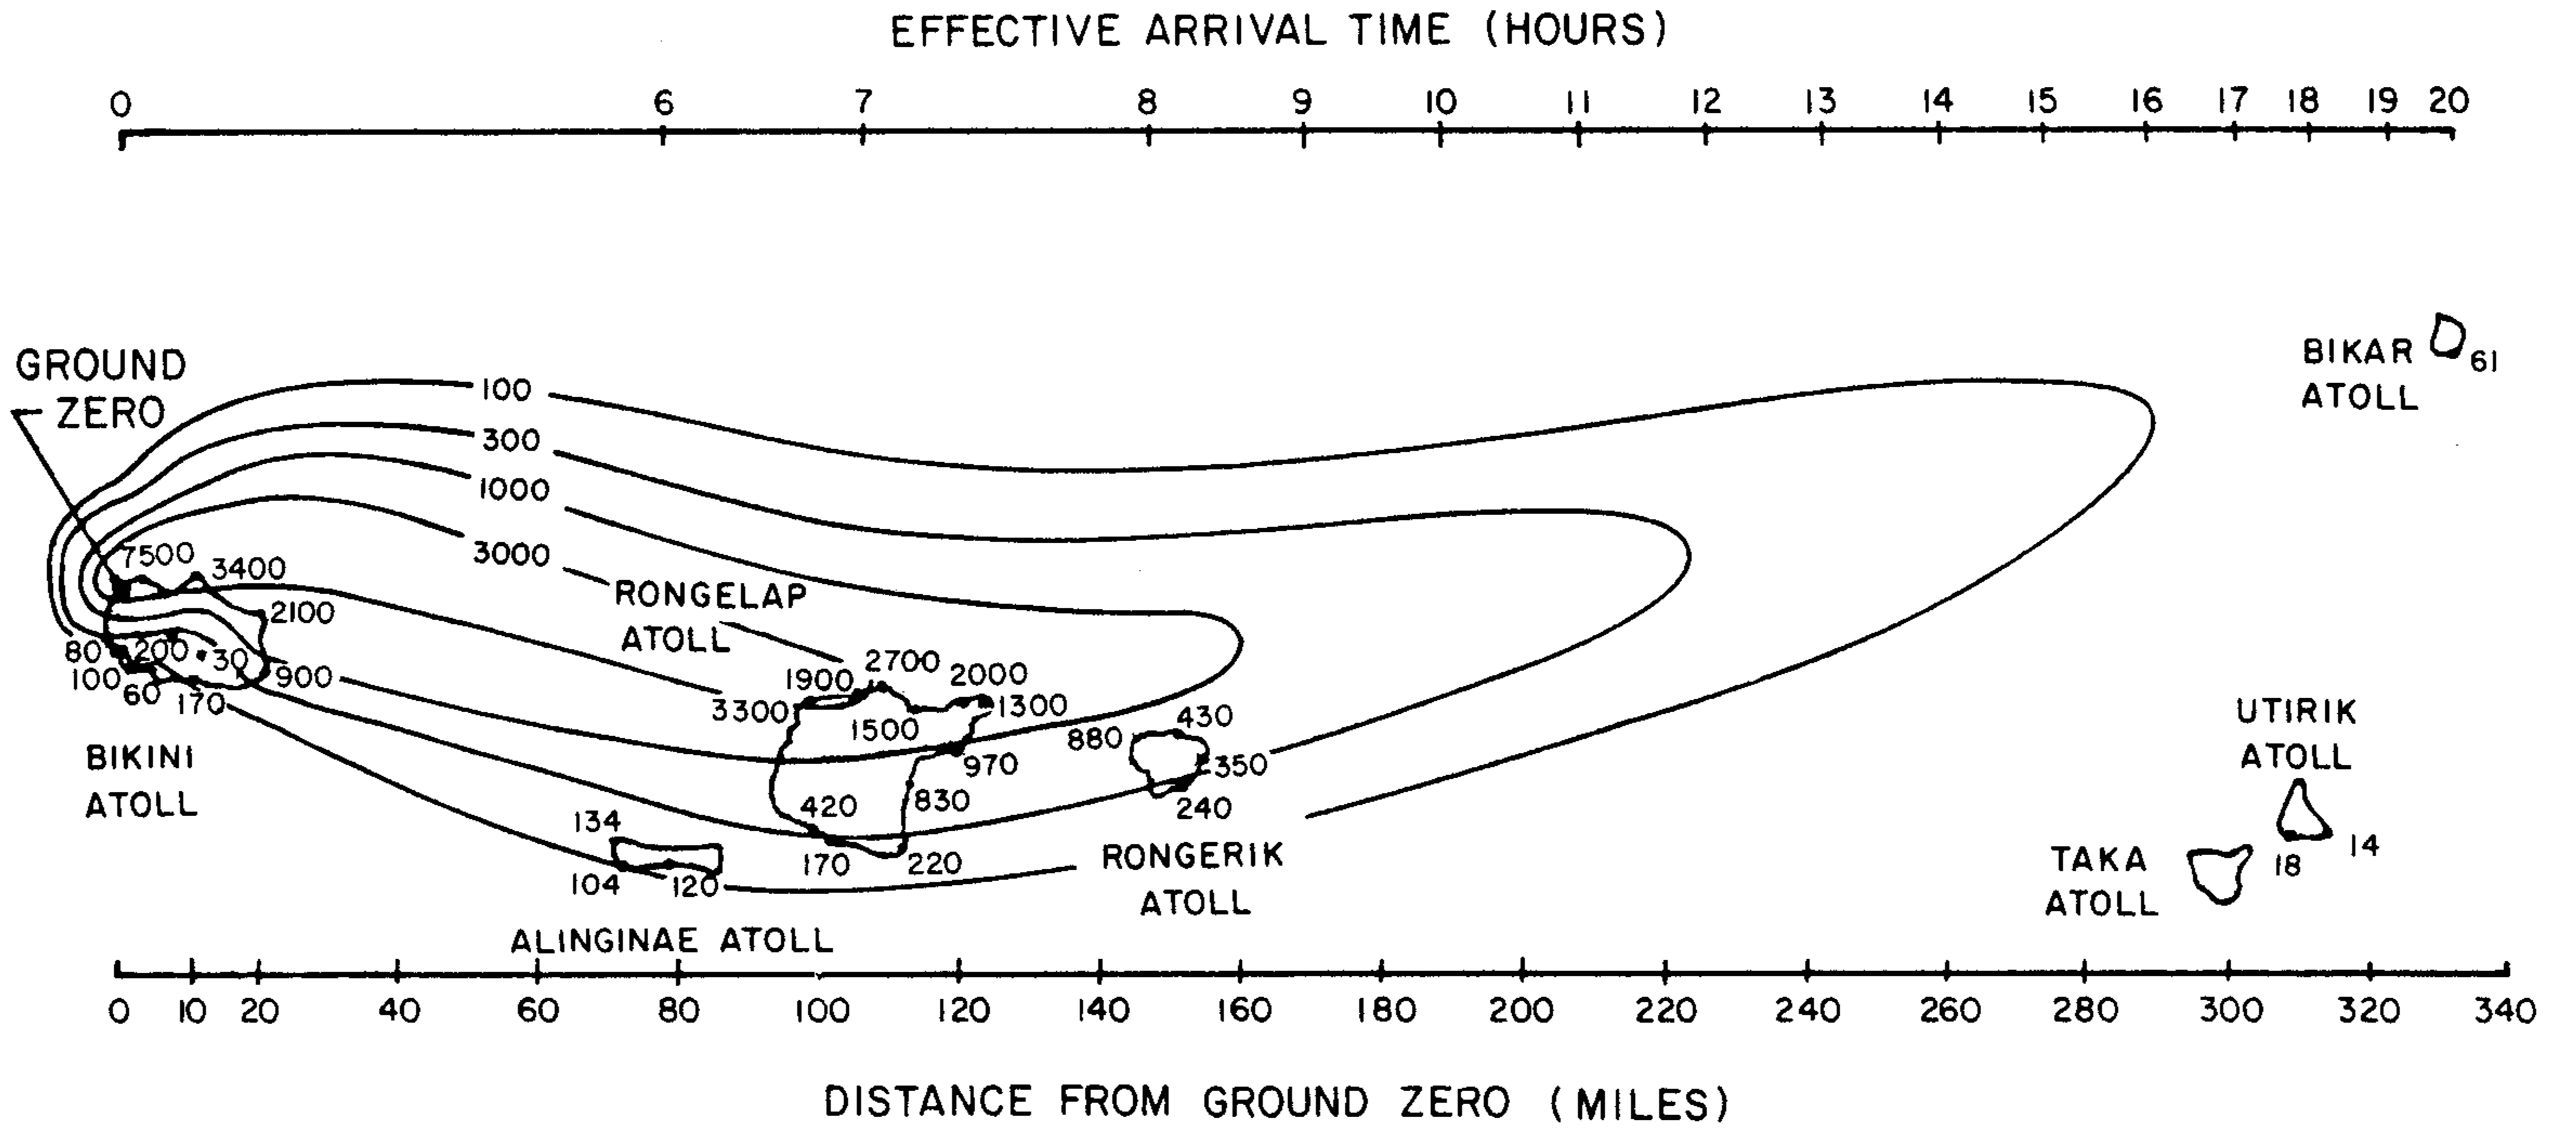
9.106 The doses to which the contours in Fig. 9.105 refer were calculated from instrument records. They represent the maximum possible exposures that would be received only by individuals who remained in the open, with no protection against the radiation, for the whole time. Any kind of shelter, e.g., within a building, or evacuation of the area would have reduced the dose received. On the other hand, persons remaining in the area for a period longer than 96 hours after the explosion would have received larger doses of the residual radiation.
9.107 A radiation dose of 700 rads over a period of 96 hours would probably prove fatal in the great majority of cases. It would appear, therefore, that following the test explosion of March 1, 1954, there was sufficient radioactivity from the fallout in a downwind belt about 170 miles long and up to 35 miles wide to have seriously threatened the lives of nearly all persons who remained in the area for at least 96 hours following the detonation without taking protective measures of any kind. At distances of 300 miles or more downwind, the number of deaths due to short-term radiation effects would have been negLigible, although there would probably have been many cases of sickness resulting in temporary incapacity.
9.108 The period of 96 hours after the explosion, for which Fig. 9.105 gives the accumulated radiation doses, was chosen somewhat arbitrarily. It should be understood, however, as has been frequently stated earlier in this chapter, that the radiations from the fallout will continue to be emitted for a long time, although at a gradually decreasing rate. The persistence of the external gamma radiation may be illustrated in connection with the BRAVO test by considering the situation at two different locations in Rongelap Atoll. Fallout began about 4 to 6 hours after the explosion and continued for several hours at both places.
9.109 The northwestern tip of the atoll, 100 miles from the point of detonation, received 3,300 rads during the first 96 hours after the fallout started. This was the heaviest fallout recorded at the same distance from the explosion and may possibly have represented a hot spot, as mentioned above. About 25 miles south, and 115 miles from ground zero, the dose over the same period was only 220 rads. The inhabitants of Rongelap Atoll were in this area, and were exposed to radiation dosages up to 175 rads before they were evacuated some 44 hours after the fallout began (§§ 12.124, 12.156). The maximum theoretical exposures in these two areas of the atoll for various time intervals after the explosion, calculated from the decay curves given earlier in this chapter, are recorded in Table 9.109.
| Accumulated dose in this period (rads) | ||
|---|---|---|
| Exposure period after the explosion | Inhabited location | Uninhabited location |
| First 96 hours | 220 | 3,300 |
| 96 hours to 1 week | 35 | 530 |
| 1 week to 1 month | 75 | 1,080 |
| 1 month to 1 year | 75 | 1,100 |
| Total to 1 year | 405 | 6,010 |
| 1 year to infinity | About 8 | About 115 |
9.110 It must be emphasized that the calculated values in Table 9.109 represent the maximum doses at the given locations, since they are based on the assumption that exposed persons remain out-of-doors for 24 hours each day and that no measures are taken to remove radioactive contamination. Furthermore, no allowance is made for weathering or the possible dispersal of the particles by winds. For example, the dose rates measured on parts of the Marshall Islands on the 25th day following the explosion were found to be about 40 percent of the expected values. Rains were known to have occurred during the second week, and these were probably responsible for the major decrease in the contamination.
9.111 In concluding this section, it may be noted that the 96-hour dose contours shown in Fig. 9.105, representing the fallout pattern in the vicinity of Bikini Atoll after the high-yield ex plosion of March 1, 1954, as well as the idealized unit-time reference dose-rate contours from Table 9.93, can be regarded as more-or-less typical, so that they may be used for planning purposes. Nevertheless, it should be realized that they cannot be taken as an absolute guide. The particular situation which developed in the Marshall Islands was the result of a combination of circumstances involving the energy yield of the explosion, the very low burst height (§ 9. 104), the nature of the surface below the point of burst, the wind system over a large area and to a great height, and other meteorological conditions. A change in any one of these factors could have affected considerably the details of the fallout pattern.
9.112 In other words, it should be understood that the fallout situation described above is one that can happen, but is not necessarily one that will happen, following the surface burst of a high fission-yield weapon. The general direction in which the fallout will move can be estimated fairly well if the wind pattern is known. But the total and fission yields of the explosion and the height of the burst, in the event of a nuclear attack, are unpredictable. Consequently, it is impossible to determine in advance how far the seriously contaminated area will extend, although the time at which the fallout will commence at any point could be calculated if the effective wind speed and direction were known.
9.113 In spite of the uncertainties concerning the exact fallout pattern, there are highly important conclusions to be drawn from the results described above. One is that the residual nuclear radiation from a surface burst can, under some conditions, represent a serious hazard at great distances from the explosion, well beyond the range of blast, shock, thermal radiation, and the initial nuclear radiation. Another is that plans can be made to minimize the hazard, but such plans must be flexible, so that they can be adapted to the particular situation which develops after the attack.
ATTENUATION OF RESIDUAL NUCLEAR RADIATION
ALPHA AND BETA PARTICLES
9.114 In their passage through matter, alpha particles produce considerable direct ionization and thereby rapidly lose their energy. After traveling a certain distance, called the “range,” an alpha particles ceases to exist as such.8
9.11S Beta particles, like alpha particles, are able to cause direct ionization in their passage through matter. But the beta particles dissipate their energy less rapidly and so have a greater range in air and in other materials. Many of the beta particles emitted by the fission products traverse a total distance of 10 feet (or more) in the air before they are absorbed. However, because the particles are continually deflected by electrons and nuclei of the medium, they follow a tortuous path, and so their effective (or net) range is somewhat less.
9.116 The range of a beta particle is shorter in more dense media, and the average net distance a particle of given energy can travel in water, wood, or body tissue is roughly one-thousandth of that in air. Persons in the interior of a house would thus be protected from beta radiation arising from fission products on the outside. It appears that even moderate clothing provides substantial attenuation of beta radiation, the exact amount varying, for example, with the weight and number of layers. Only beta radiation from material ingested or in contact with the body poses a hazard.
GAMMA RADIATION
9.117 The residual gamma radiations present a different situation. These gamma rays, like those which form part of the initial nuclear radiation, can penetrate considerable distances through air and into the body. Shielding will be required in most fallout situations to reduce the radiation dose to an acceptable level. Incidentally, any method used to decrease the gamma radiation will also result in a much greater attenuation of both alpha and beta particles.
9.118 The absorption (or attenuation) by shielding materials of the residual gamma radiation from fission products and from radioisotopes produced by neutron capture, e.g., in sodium, manganese, and in the weapon residues, is based upon exactly the same principles as were described in Chapter VIII in connection with the initial gamma radiation. Except for the earliest stages of decay, however, the gamma rays from fallout have much less energy, on the average, than do those emitted in the first minute after a nuclear explosion. This means that the residual gamma rays are more easily attenuated; in other words, compared with the initial gamma radiation, a smaller thickness of a given material will produce the same degree of attenuation.
9.119 Calculation of the attenuation of the gamma radiation from fallout is different and in some ways more complicated than for the initial radiations. The latter come from the explosion point, but the residual radiations arise from fallout particles that are widely distributed on the ground, on roofs, trees, etc. The complication stems from the fact that the effectiveness of a given thickness of material is influenced by the fallout distribution (or geometry) and hence depends on the degree of contamination and its location relative to the position where protection is desired. Estimates of the attenuation of residua radiation in various structures have been made, based partly on calculations and partly on measurements with simulated fallout.
9.120 Some of the results of these estimates are given in Table 9.120 in terms of a dose-transmission factor (§ 8.72). Ranges of values are given in view of the uncertainties in the estimates themselves and the variations in the degree of shielding that may be obtained at different locations within a structure. (Shielding data for the same structures for initial nuclear radiation are given in Table 8.72.) All of the structures are assumed to be isolated, so that possible effects of adjacent buildings have been neglected. For vehicles, such as automobiles, buses, trucks, etc., the transmission factor is about 0.5 to 0.7. Rough estimates can thus be made of the shielding from fallout radiation that might be expected in various situations. Depending upon his location, a person in the open in a built-up city area would receive from about 20 to 70 percent of the dose that would be delivered by the same quantity of fallout in the absence of the buildings. An individual standing against a building in the middle of a block would receive a much smaller dose than one standing at the intersection of two streets. In contaminated agricultural areas, the gamma-ray dose above the surface can be reduced by turning over the soil so as to bury the fallout particles.
| Structure | Dose transmission factor |
|---|---|
| Three feet underground | 0.0002 |
| Frame House | 0.3-0.6 |
| Basement | 0.05-0.1 |
| Multistory building (apartment type): | |
| Upper stories | 0.01 |
| Lower stories | 0.1 |
| Concrete blockhouse shelter: | |
| 9-in. walls | 0.007-0.09 |
| 12-in walls | 0.001-0.03 |
| 24-in walls | 0.0001-0.002 |
| Shelter, partly above grade: | |
| With 2 ft earth cover | 0.005-0.02 |
| With 3 ft earth cover | 0.001-0.005 |
DELAYED FALLOUT
INTRODUCTION
9.121 There is, of course, no sharp change at 24 hours after a nuclear explosion when, according to the arbitrary definition (§ 9.03), the early fallout ends and the delayed fallout commences. Nevertheless, there is an important difference between the two types of fallout. The principal early fallout hazard is from exposure to gamma rays from sources outside the body, although there is also a possibility of some internal exposure (§ 9.16). A secondary hazard would arise from beta particles emitted by fallout in contact with the skin. The delayed fallout, on the other hand, is almost exclusively a potential internal hazard that would be due to the ingestion of iodine, strontium, and cesium isotopes present in food, especially milk. Both early and delayed fallout can have long-term genetic effects, but they are probably of less significance than other expected consequences. These and related biological aspects of fallout are discussed in Chapter XII.
9.122 Essentially all of the residues from an air burst contribute to the delayed fallout, for in an explosion of this type there is very little early (or local) fallout. For land surface bursts, about 40 percent of the radioactivity of the weapons residues remains in the atmosphere after the early fallout and for water surface bursts the proportion has been estimated to be roughly 70 percent (§ 9.59). The time required for the debris particles to descend to earth and the distance they will have traveled during this time depend on the size of the particles and the altitude to which they have ascended in the nuclear cloud. The very fine particles, e.g., those with radii of a few micrometers or less, fall extremely slowly. Consequently, they may remain suspended in the atmosphere for a considerable time and may be carried over great distances by the wind. Ultimately, however, the particles are brought to the ground, primarily by precipitation scavenging (§ 9.67 et seq.), and the resulting delayed fallout will be spread over large areas of the earth’s surface.
9.123 Much (if not all) of the debris from low air and surface bursts with yields less than about 100 kilotons does not rise above 30,000 feet or so (Fig. 9.96) and it soon becomes accessible to removal by precipitation. Should this occur within the first few weeks after the explosion, as it often will, the fallout will still contain appreciable amounts of radioisotopes with fairly short half lives, as well as those with long half lives. The main potential hazard then arises from the ingestion of iodine-131, which has a half-life of 8 days; like all isotopes of iodine, when it enters the body this isotope tends to become concentrated in the thyroid gland(§ 12.169 et seq.). Iodine-131 has been detected in rainfall and in milk from cows which have eaten contaminated forage at distances several thousand miles from but in the same hemisphere as the burst point. With increasing yield, a smaller proportion of the weapon debris remains in the atmosphere below 30,000 to 40,000 feet, from which it can be removed fairly rapidly; but this may be sufficient to produce significant deposition of iodine-131 on the ground, especially if the total fission yield is large.
9.124 For explosions of moderately high and high yields, most of the radioactive residues enter the stratosphere from which removal occurs slowly. The small particles in the stratosphere are effectively held in storage for a few months up to a few years, as will be seen shortly (§ 9.135 et seq.). During this time, the radioisotopes of short and moderate half-life will have decayed almost completely. Radioactive species with intermediate half-lives, from about a month to a year, have been detected on the ground within a few months after a nuclear test series. But the major biological hazard of the delayed fallout is from the long-lived isotopes strontium-90 (half-life 27.7 years) and cesium-137 (half-life 30.0 years) which might enter the body in food over a period of years. Strontium-90 can accumulate in the bone from which it is removed slowly by radioactive decay and by natural elimination processes; it can thus represent a prolonged internal hazard (§ 12.188 et seq.). Not only do these isotopes of strontium and cesium decay slowly, they constitute relatively large fractions of the fission products; thus, for every 1,000 atoms undergoing fission there are eventually formed from 30 to 40 atoms of strontium-90 and from 50 to 60 of cesium-137. Moreover, both of these isotopes have gaseous precursors (or ancestors), so that as a result of fractionation (§ 9.08) their proportions in the delayed fallout will tend to be greater, at least for surface bursts, than in the fission products as a whole.
9.125 The ultimate distribution of the delayed fallout over the earth’s surface is not affected by the particular wind conditions at the time of the detonation nearly as much as that of the early fallout. What is more important is the manner in which the contaminated particles enter the upper atmosphere. In order to understand the situation, it is necessary to review some of the characteristic features of the atmosphere.
STRUCTURE OF THE ATMOSPHERE
9.126 One of the most significant aspects of the atmosphere is the variation in temperature at different altitudes and its dependence on latitude and time. In ascending into the lower atmosphere from the surface of the earth, the temperature of the air falls steadily, in general, toward a minimum value. This region of falling temperature is called the “troposphere” and its top, where the temperature ceases to decrease, is known as the “tropopause.” Above the troposphere is the “stratosphere,” where the temperature remains more or less constant with increasing altitude in the temperate and polar zones. Although all the atmosphere immediately over the tropopause is commonly referred to as the stratosphere, there are areas in which the structure varies (Fig. 9.126). In the equatorial regions, the temperature in the stratosphere increases with height. This inversion also occurs at the higher altitudes in the temperate and polar regions. In the “mesosphere” the temperature falls off again with increasing height. At still higher altitudes is the “thermosphere” where the temperature rises rapidly with height.
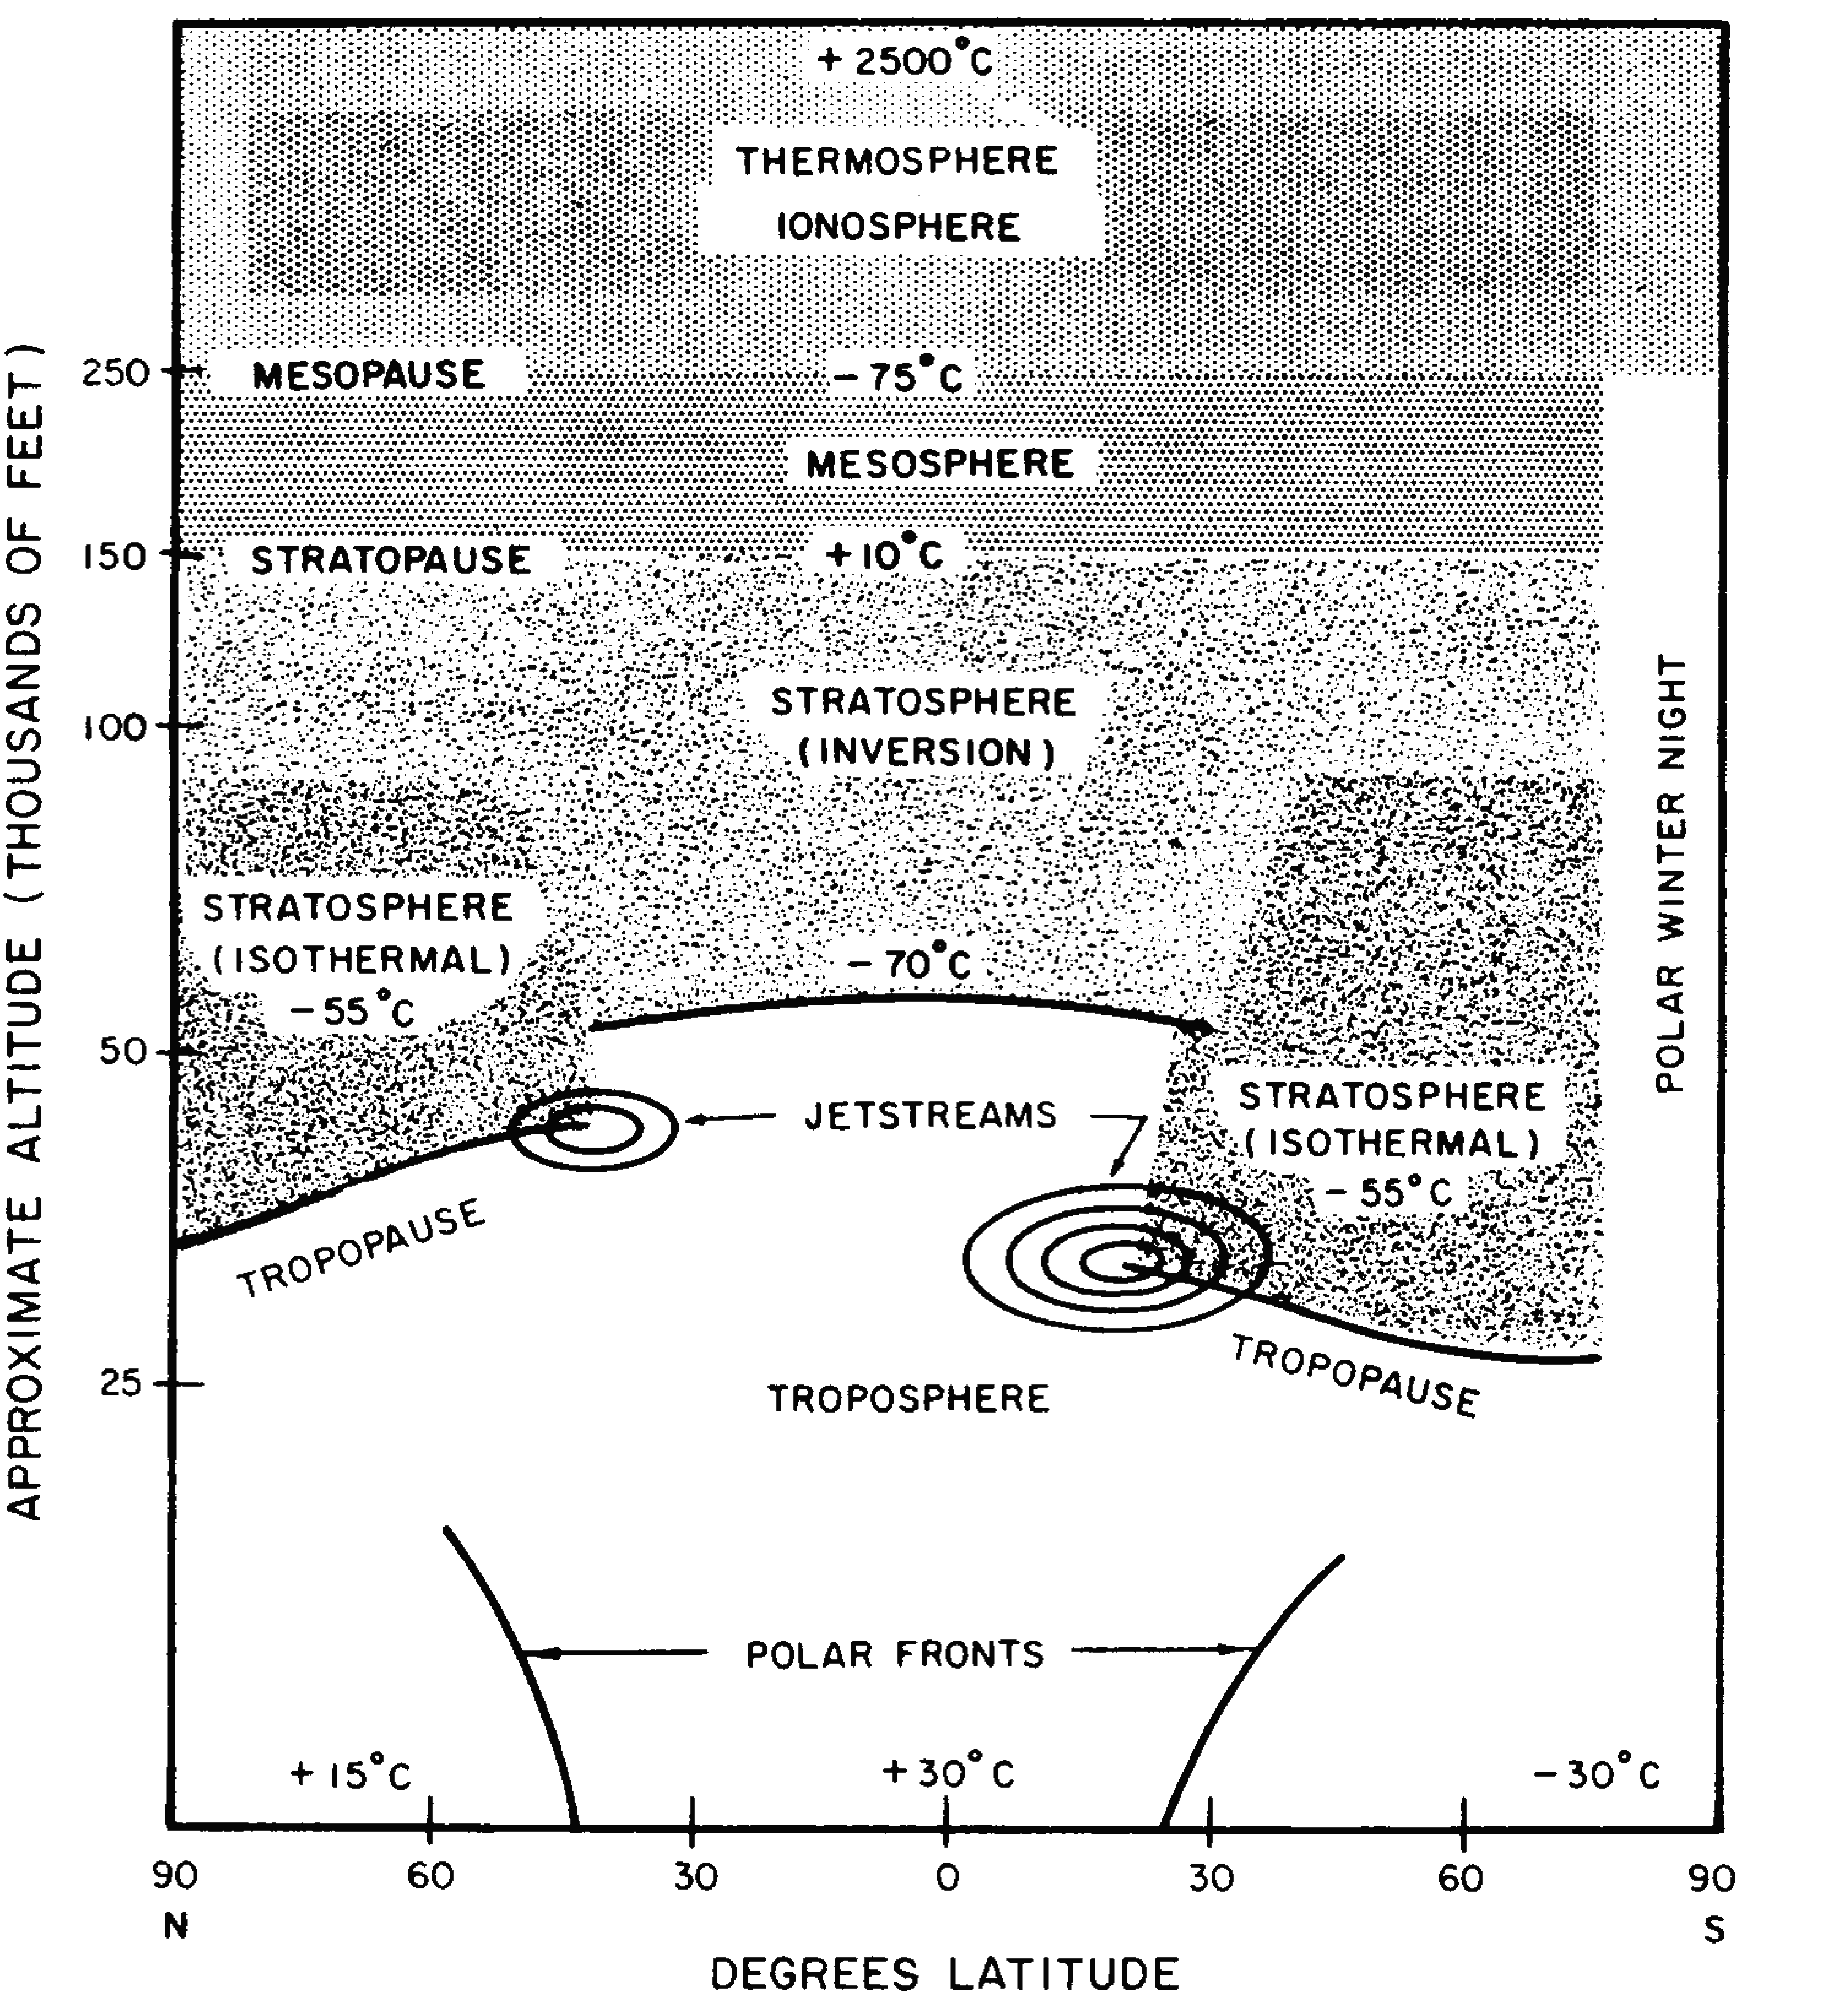
9.127 Most of the visible phenomena associated with weather occur in the troposphere. The high moisture content, the relatively high temperature at the earth’s surface, and the convective movement (or instability) of the air arising from temperature differences promote the formation of clouds and rainfall. In the temperate latitudes, at about 45° in the summer and 30° in the winter, where the cold polar air meets the warm air of the tropics, there are formed meandering, wavelike bands of storm fronts called “polar fronts” (Fig. 9.126). In these regions, the average rainfall is high.
9.128 The tropopause, that is the top of the troposphere, is lower in the polar and temperate zones than in the tropics; its height in the former regions varies from 25,000 to 45,000 feet, depending on latitude, time of year, and particular conditions of the day. In general, the altitude is lowest in the polar regions. The tropopause may disappear entirely at times in the polar winter night. In the tropics, the tropopause usually occurs near 55,000 feet at all seasons. It is more sharply defined than in the temperate and polar regions because in the tropics the temperature increases with height above the tropopause instead of remaining constant. There is a marked gap or discontinuity in the tropopause in each temperate zone, as may be seen in Fig. 9.126, that constitutes a region of unusual turbulence. Each gap moves north and south seasonally, following the sun, and is usually located near a polar front. It is believed that considerable interchange of air between the stratosphere and troposphere takes place at the gaps. A jet stream, forming a river of air moving with high speed and circulating about the earth, is located at the tropical edge of the polar tropopause in each hemisphere.
9.129 Because of its temperature structure, there is very little convective motion in the stratosphere, and the air is exceptionally stable. This is especially noticeable in the tropics where the vertical movement of the radioactive cloud from a nuclear explosion has sometimes been less than 2 miles in three trips around the globe, i.e., approximately 70,000 miles. This stability continues up to the mesosphere where marked turbulence is again noted. The polar stratosphere is less stable than that in the tropics, particularly during the polar winter night when the stratospheric temperature structure changes to such an extent that the inversion may disappear. When this occurs there may be considerable convective mixing of the air to great heights.
ATMOSPHERIC PATHS OF DELAYED FALLOUT: TROPOSPHERIC FALLOUT
9.130 The fallout pattern of the very small particles in the radioactive cloud which remain suspended in the atmosphere depends upon whether they were initially stabilized in the troposphere or in the stratosphere. The distribution of the radioactive material between the troposphere and the stratosphere is determined by many factors, including the total energy yield of the explosion, the height of burst, the environment of the detonation, and the height of the tropopause. Additional complications arise from scavenging by dirt and precipitation and from fractionation in surface bursts. Scavenging will tend to decrease the proportion of radioactive debris remaining in the cloud while increasing that in the early fallout, whereas fractionation will result in a relative increase in the amounts of strontium-90 and cesium-137 that remain suspended. Consequently, it is not yet possible to predict the quantitative distribution between troposphere and stratosphere, although certain qualitative conclusions can be drawn.
9.131 In general, a larger proportion of the weapon debris will go into the stratosphere in an air burst than in a surface burst under the same conditions; for one thing, there is essentially no local or early fallout in the former case and, for another, surface material taken up into the cloud tends to depress the height attained in the latter case. In the temperate and polar regions, more of the radioactive debris enters the stratosphere from an air burst than for an equivalent burst in the tropics. The reason is that the tropopause is lower and the stratosphere is less stable in the nontropic regions. For low-yield explosives, most of the radioactive material remains in the troposphere, with little entering the stratosphere. But since the altitude to which the cloud rises increases with the explosion energy yield, the proportion of debris passing into the stratosphere will increase correspondingly.
9.132 The small particles remaining in the troposphere descend to earth gradually over a period of time up to several months; this constitutes the “tropospheric fallout.” The most important mechanism for causing this fall out appears to be the scavenging effect of rain and snow. The fine particles may be incorporated into the water droplets (or snow crystals) as they are formed and are thus brought down in the precipitation. Except for unusually dry or wet regions, the amount of delayed fallout deposited in adjacent areas is closely related to the amount of precipitation in those areas during the fallout period. Dry fallout has been recorded, but it probably represents a minor pro portion of the tropospheric fallout in most instances.
9.133 The rate of removal of material from the troposphere at any time is roughly proportional to the amount still present at that time; consequently, the “half-residence time” concept is useful. It is defined as the period of time required at a given location for the removal of half the suspended material. If the cloud particles originally reached the upper part of the troposphere, the half residence time for tropospheric fallout is about 30 days. During the course of its residence in the atmosphere, the tropospheric debris is carried around the earth, by generally westerly winds, in perhaps a month’s time. The bulk of the fallout on the average is then confined to a relatively narrow belt that spreads to a width of about 30° of latitude.
9.134 Since uniform winds and rainfall are not very probable, the tropospheric fallout patterns, like those of the early fallout, will vary and probably will be quite irregular. In view of the strong dependence of tropospheric fall out distribution on the weather, and in particular on precipitation, it is not practical to provide an idealized representation of the possible distribution.
STRATOSPHERIC FALLOUT
9.135 The radioactive debris that enters the stratosphere descends much more slowly than does the tropospheric fallout. This is mainly due to the fact that vertical motions in the stratosphere are slow, as stated above, and little moisture is available to scavenge the particles. It appears that almost the only way for the removal of the radioactivity from the stratosphere is for the air masses carrying the particles to move first into the troposphere, where the particles can be brought down by precipitation. There are at least three ways in which this transfer of air from the stratosphere to the troposphere can occur, they are (1) direct downward movement across the tropopause, (2) upward movement of the tropopause or its reformation at a higher altitude, and (3) turbulent, large-scale meandering horizontal circulation through the tropopause gaps. The relative importance of these mechanisms depends upon the altitude, latitude, and time of year at which the injection into the stratosphere takes place. The first method may be important during the arctic winter and the second in the lower polar stratosphere in the early spring. The third mechanism is particularly applicable to material in the lower stratosphere near the gaps. Very little debris crosses the tropopause in equatorial regions.
9.136 The relatively complicated structure of the stratosphere and the varied modes by which contaminated particles may leave it, make it impossible to assign a single half-residence time for all stratospheric debris. However, semiempirical models have been developed that permit the calculation of stratospheric inventories, concentrations in air near the surface, and deposition of debris injected into the stratosphere, mesosphere, or higher levels. The model used here has successfully predicted the fallout from several specific injections of radioisotopes from atmospheric nuclear tests conducted since 1961. It also predicted the fate of the substantial amount of plutonium-238 released in the burnup of the SNAP-9A generator in a satellite launch-vehicle failure in 1964.
9.137 The model divides the stratosphere of each of earth’s (north and south) hemispheres into two compartments: the region above 70,000 feet and that below 70,000 feet. For an injection of radioactive debris at an initial altitude above 70,000 feet, rapid transfer between the hemispheres is assumed to take place, based on what is known of air circulation in the upper atmosphere. The debris will begin to arrive below 70,000 feet during the winter or spring season in each hemisphere after a delay of about one year from the time of injection. If the injection occurs in the stratosphere below 70,000 feet, the major influx of debris into the troposphere will begin during the first winter or spring season following the injection. At this lower altitude in the stratosphere, transfer between the hemispheres takes place at a much slower rate. Most of the radioactive debris tends initially to become a narrow band girdling the globe more or less at the latitude of injection, since the winds in the stratosphere below 70,000 feet are predominantly unidirectional, i.e., either easterly or westerly, depending on the place and the time. The band soon spreads out as a result of diffusion and in the winter and spring there is a poleward and downward transfer of the debris.
9.138 In the lower stratosphere, below 70,000 feet, the half-residence time for transfer between hemispheres is roughly 60 months, whereas the half residence time for transfer to the troposphere is about 10 months. Since the half-residence time in the troposphere is only a month (§ 9.133), it is apparent that weapon residues entering the lower stratosphere in a particular hemisphere will tend to fall out in that hemisphere. Most nuclear tests have been conducted in the Northern Hemisphere and most of the debris injected into the stratosphere did not reach altitudes above 70,000 feet. Consequently, the amount of delayed fallout on the ground in this hemisphere is considerably greater than in the Southern Hemisphere. On the other hand, in the upper stratosphere, above 70,000 feet, the transfer between hemispheres is much more rapid than in the lower region and entry into the troposphere is delayed. Hence, in the few injections that have occurred above 70,000 feet there has been a more even distribution of the fallout between the hemispheres.
9.139 Regardless of where it is injected, the major portion of the stratospheric fallout will reach the earth in the temperate latitudes. This is mainly due to high-rainfall regions near the polar fronts (§ 9.127). Since the half-residence time in the troposphere is so short, air coming down through the tropopause gap or on its poleward side and moving toward the equator will be depleted of its contaminated particles by scavenging before it can reach the tropics. Consequently, stratospheric fallout in the equatorial zone is low in spite of the heavy rainfall.
DELAYED FALLOUT FROM NUCLEAR WEAPONS TESTS
9.140 For making estimates of delayed fallout, it is the general practice to determine the amount of strontium-90, for several reasons. It has a long half life compared with the residence time in the stratosphere, so that it does not decay to any great extent prior to its deposition on the earth; it is produced in relatively large quantities in fission, and it is fairly easy to identify and measure by standard radiochemical techniques. Furthermore, the concentration of strontium-90 is of special interest because it provides a measure of the hazard from delayed fallout.
9.141 The activity of strontium-90, as of radioactive materials in general, is conveniently expressed in terms of a unit called the “curie.” It is defined as the activity (or quantity) of any radioactive substance undergoing 3.7 × 10¹⁰ disintegrations per second. (This particular rate was chosen because it is close to the rate of disintegration of 1 gram of radium.) Where large amounts of active material are involved, the “megacurie” unit is employed; this is equal to 1 million curies and corresponds to disintegrations at the rate of 3.7 × 10¹⁶ per second. A megacurie of strontium-90 is that quantity of this isotope which emits 3.7 × 10¹⁶ beta particles per second.9
9.142 Since 1954, a number of sampling networks have been established in various parts of the world to determine the amounts of radioactive contamination in tropospheric and stratospheric air and in rainwater and soil, arising from weapons tests. The results obtained have shed a great deal of light on the possible mechanisms of the delayed fallout. The information so obtained, coupled with biological studies to determine the concentrations of certain radioisotopes in the diet and in human beings and animals, has permitted an evaluation to be made of the possible worldwide hazard (see Chapter XII).
9.143 The plots in Figs. 9.143a and b show the variations over a period of years of the megacuries of strontium-90 present in the total stratospheric inventory, i.e., the activity still remaining in the stratosphere at various times, and the ground inventory, i.e., the activity deposited on the ground. The extensive atmospheric nuclear test programs conducted by the U.S. and the U.S.S.R. during 1961 and 1962 are reflected by the large peak in the stratospheric inventory (Fig. 9.143a) which reached a maximum toward the end of 1962. The sharp increase in the ground inventory (Fig. 9.143b), which began in 1962 and continued through 1965, reflects the deposition of the strontium-90 during those years.
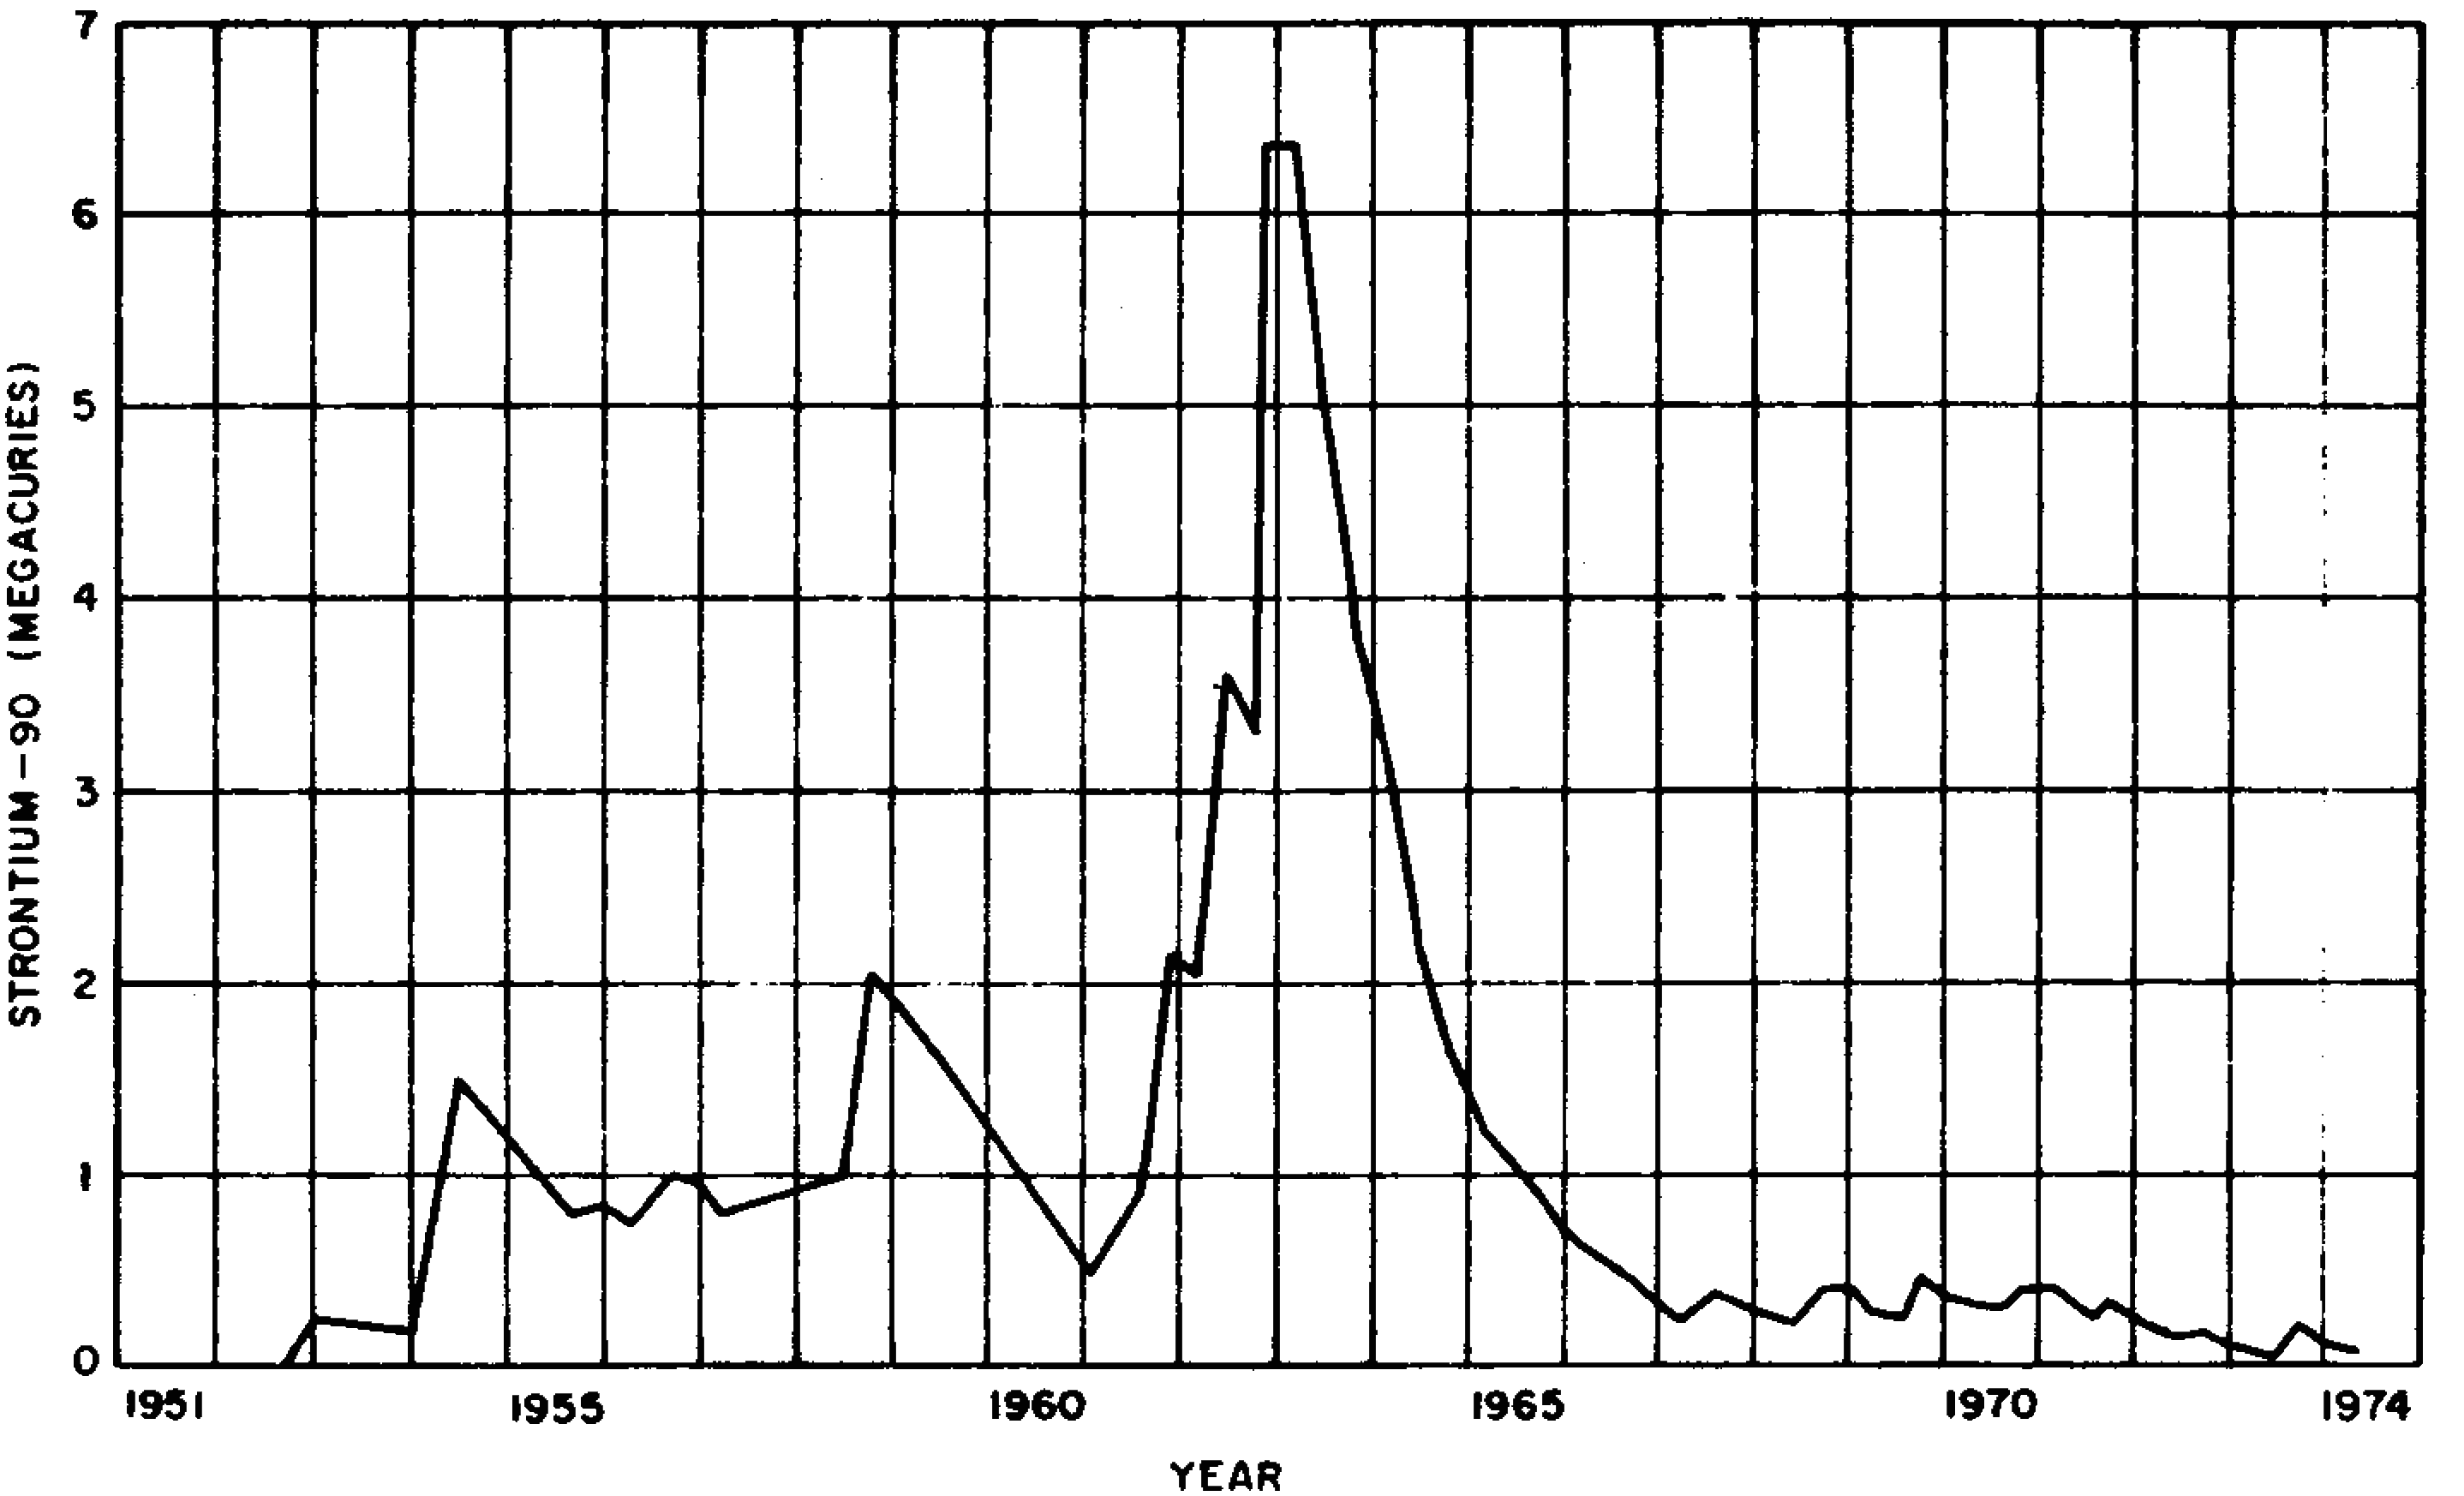
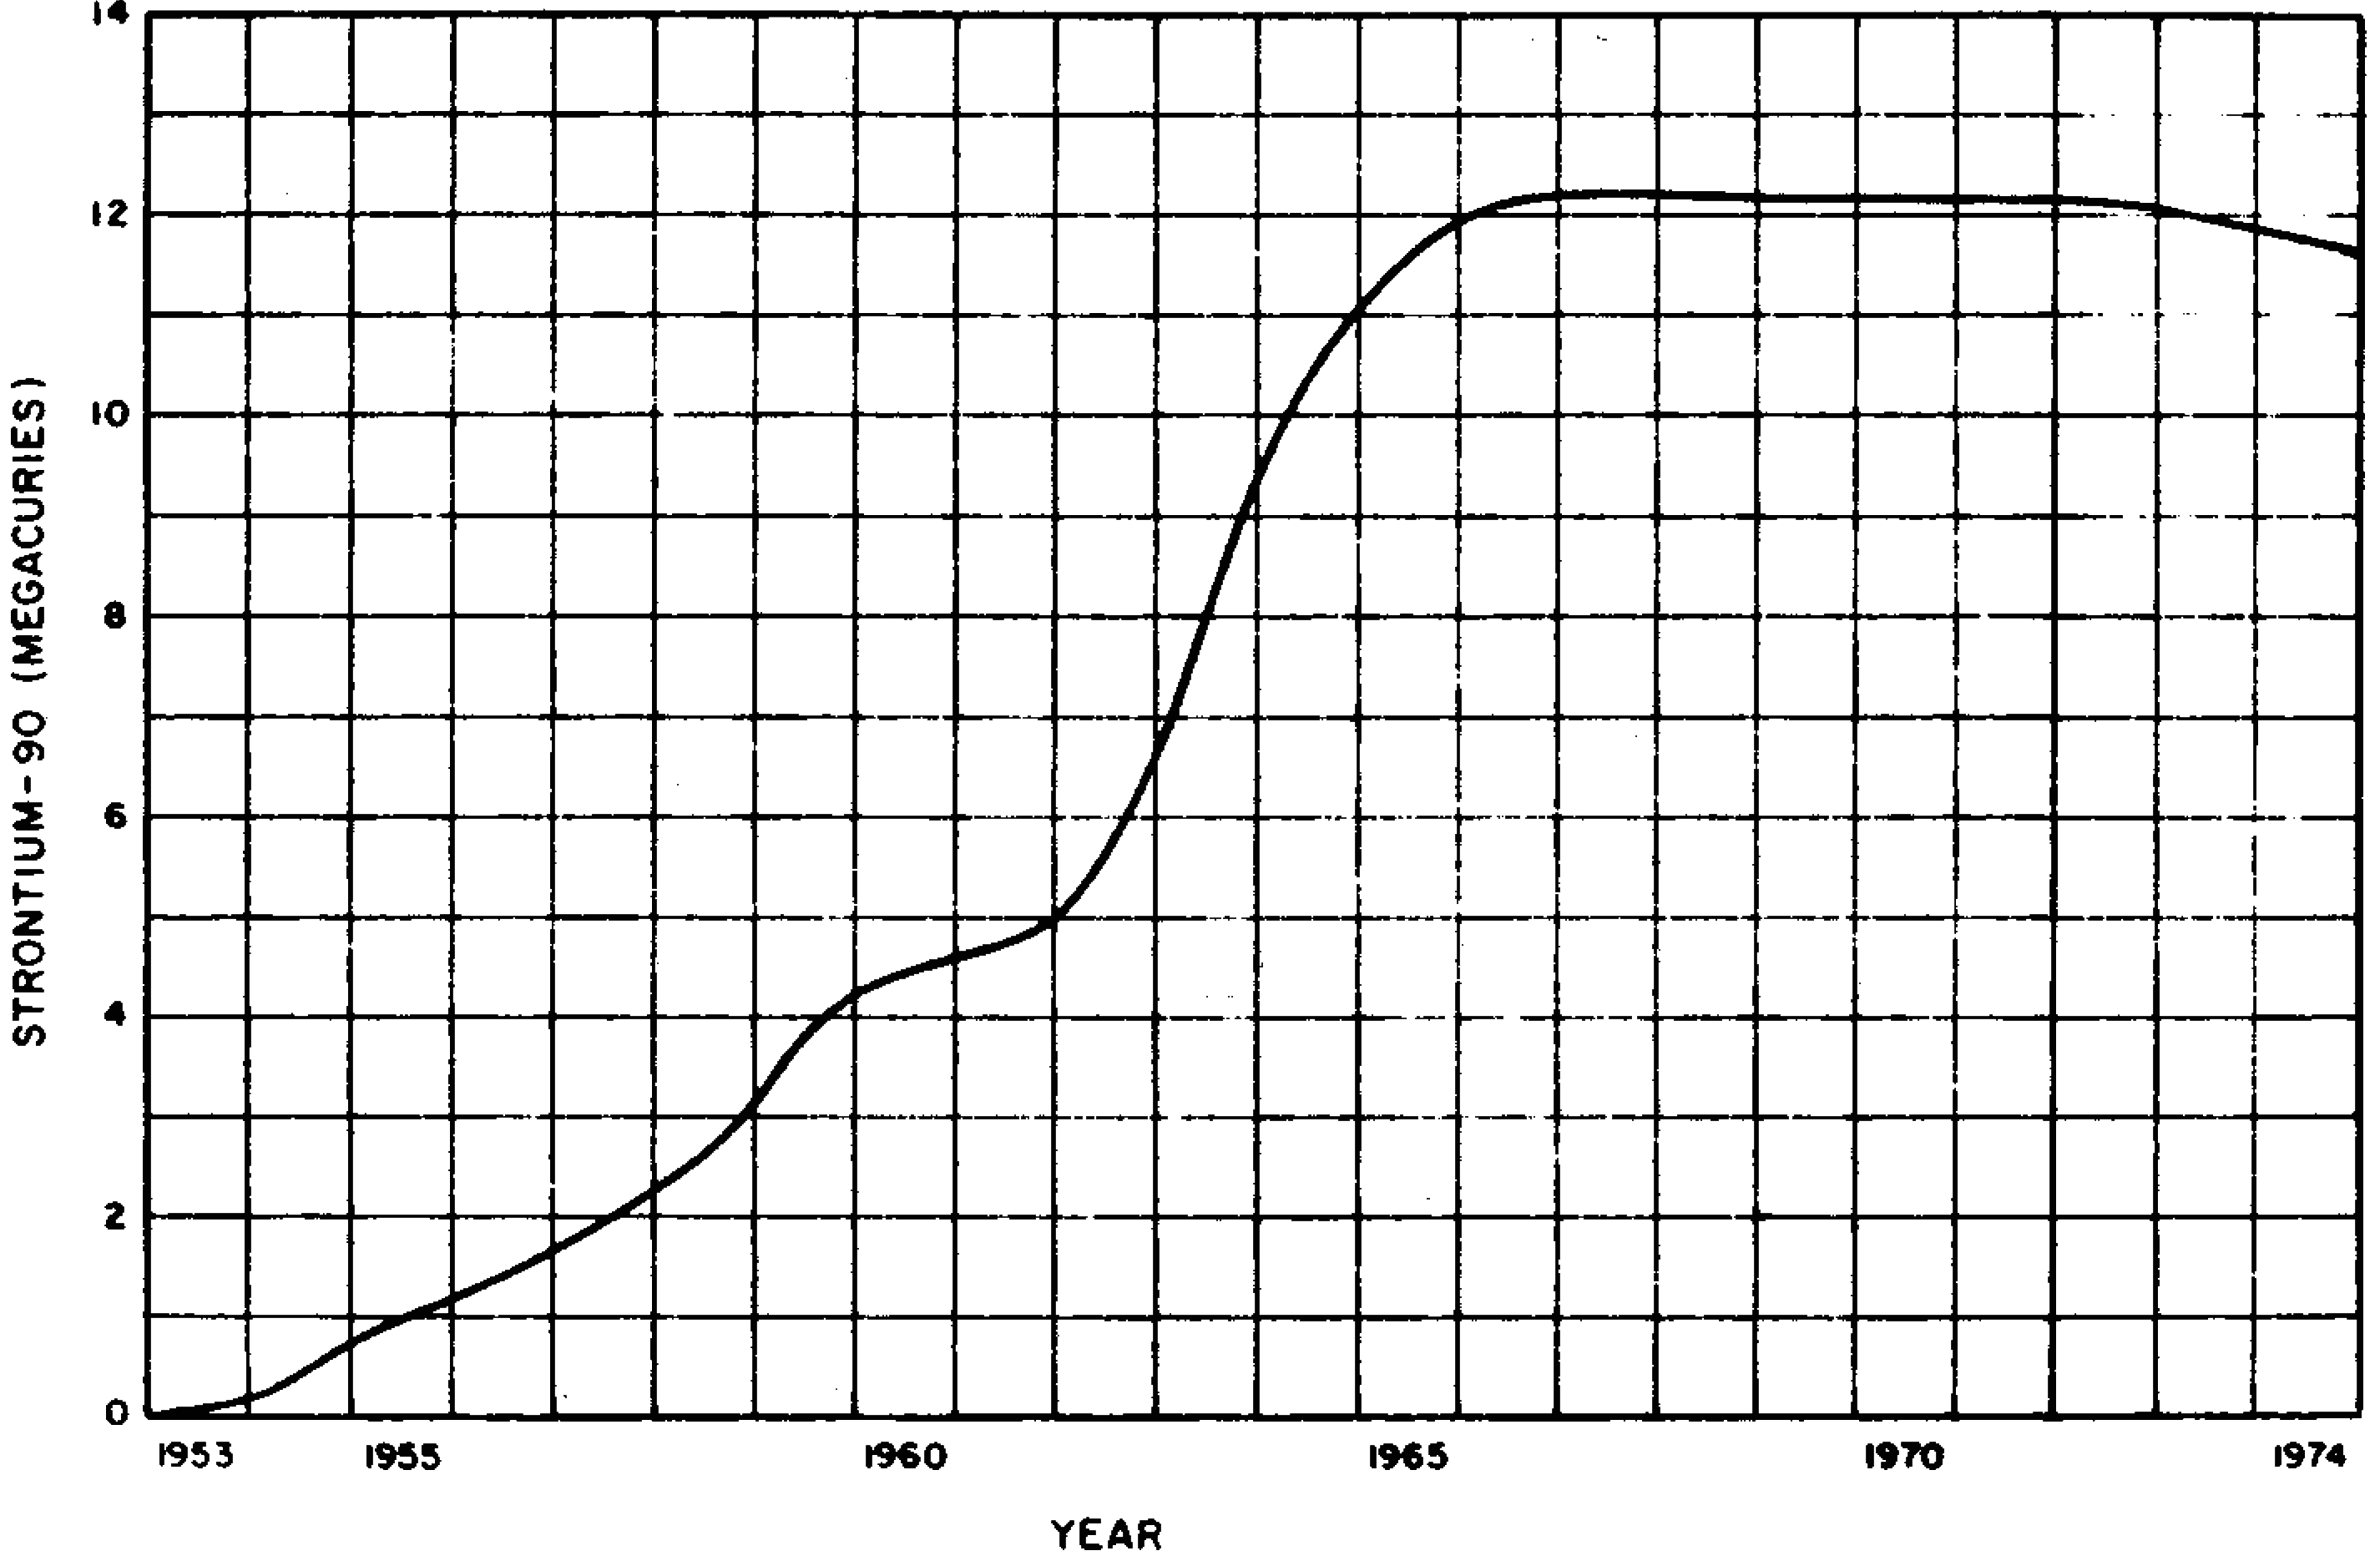
9.144 The maximum amounts of strontium-90 on the earth’s surface will be attained when the rate of natural radioactive decay just begins to exceed the rate at which the isotope reaches the ground in delayed fallout. The atmospheric tests conducted by France and China during the late 1960’s and early 1970s have not caused a significant increase in the surface inventory, and if atmospheric testing was discontinued, the surface inventory should decrease steadily.
9.145 After strontium-90, the next most important radioisotope from the biological standpoint in the worldwide fallout is cesium-137. Fission products contain, after a short time, roughly 1.5 times as many cesium-137 atoms as strontium-90 atoms (§ 9.124). Since there is essentially no fractionation relative to one another of these two isotopes and they have half-lives which are not very different, the activity of cesium-137 on the ground can be determined, to a good approximation, by multiplying the values for strontium-90, e.g., Fig. 9.143b, by 1.5.
TECHNICAL ASPECTS OF RESIDUAL NUCLEAR RADIATION10
RATE OF DECAY OF FALLOUT ACTIVITY
9.146 The continuous curves in Figs. 9.16a and b, which represent the decrease in dose rate due to gamma radiation from radioactive fallout, have been obtained by summing the contributions of the more than 300 isotopes in the fission products and of the activity induced by neutrons in the weapons materials for various times after fission. The effects of fractionation, resulting from the partial loss of gaseous krypton and xenon (and their daughter elements) and from other circumstances, have also been taken into account (§ 9.08). The dose rates calculated in this manner vary with the nature of the weapon, but the values plotted in Figs. 9.16a and b are reasonable averages for situations in which the fallout activity arises mainly from fission products. It is seen that the decrease in the dose rate with time can not be represented by a simple equation which is valid at all times, but it can be approximated by the dashed straight lines labeled “$t^{-1.2}$”, for times between 30 minutes to about 5,000 hours (200 days) after the explosion, to within 25 percent. For times longer than 200 days, the fallout decays more rapidly than indicated by the $t^{-1.2}$ line, so that the continuous curve may be used to estimate dose rates from fallout at these times.
9.147 During the interval in which the approximation is applicable, the decay of fallout activity at a given location may be represented by the simple expression
9.148 It should be clearly understood that equation (9.147.1) is applicable provided there is no change in the quantity of fallout during the time interval under consideration. It cannot be used, therefore, at such times that the fallout is still descending, but only after it is essentially complete at the particular location. If fallout material is removed in any way, e.g., by weathering or by washing away during the time t, or if additional material is brought to the given point by wind or by another nuclear detonation, equation (9.147.1) could not be employed to determine the rate of decay of the fallout activity.
9.149 By rearranging equation (9.147.1) and taking logarithms, it follows that
9.150 The total accumulated dose received from a given quantity of fallout can be determined from Fig. 9.20 using the method described in § 9.21. The curve in Fig. 9.20 was obtained by numerical integration over time of the actual dose-rate (continuous) curve in Figs. 9.16a and b. However, for times between 0.5 hour (30 minutes) and 5,000 hours (200 days) after the explosion, an approximate analytical expression for the dose received during a given time interval can be obtained by direct integration of equation (9.147.1); thus if D is the total dose accumulated between the times ta and tb, then
Hence if the unit-time reference dose rate $R_1$ is known or is determined, e.g., from Fig. 9.25 and the measured dose rate at any known time after the explosion, the total (or accumulated) dose for any required period can be calculated, provided the fallout activity decays in accordance with the $t^{-1.2}$ relationship during this period.
9.151 Measurements made on actual fallout from weapons tests indicate that, although the $t^{-1.2}$ decay represents a reasonable average, there have been instances where exponents in the range of -0.9 to -2.0, rather than -1.2, are required to represent the rate of decay. In fact, different exponents are sometimes needed for different times after the same explosion. These anomalies apparently arise from the particular circumstances of the explosion and are very difficult to predict, except possibly when a large quantity of neutron-induced activity is known to have been produced. Furthermore, fallout from two or more explosions occurring at different times will completely change the observed decay rate. In general, too, over a long period of time after the burst, weathering will tend to alter the dose rates in an unpredictable manner. Consequently, in an actual situation following a nuclear detonation, estimates based on either the $t^{-1.2}$ decay rule or even on the continuous curves in Figs. 9.16a and b must be used with caution and should be verified by actual measurements as frequently as possible.
9.152 Within the limits of applicability of $t^{-1.2}$ decay relationship, equation (9.150.1) can be used to estimate the time which an individual can stay in a location contaminated by fission products without accumulating more than a specified dose of radiation. In this case, the accumulated dose is specified; $t_a$ is the known time of entry into the contaminated area and $t_b$ is the required time at (or before) which the exposed individual must leave. In order to solve this problem with the aid of equation (9.150.1), it is necessary to know the unit-time reference dose rate $R_1$. This can be obtained from equation (9.149.1), if the dose rate, $R_d$, is measured at any time, $t$, after the explosion, e.g., at the time of entry. The results can be expressed graphically as in Figs. 9.26 and 9.27.
9.153 In principle, equation (9.150.1) could be used to estimate the total accumulated dose received from fallout in a contaminated area, provided the whole of the fallout arrives in a very short time. Actually, the contaminated particles may descend for several hours, and without knowing the rate at which the fallout particles reach the ground, it is not possible to make a useful calculation. When the fallout has ceased, however, equations (9.149.1) and (9.150.1) may be employed to make rough estimates of accumulated radiation doses over moderate periods of time, up to about 200 days after the explosion, provided one measurement of the dose rate is available.
RADIATION DOSE RATES OVER CONTAMINATED SURFACES
9.154 It was seen in § 9.141 that the curie and megacurie are useful units for expressing the activity of radioactive material, and they will now be employed in connection with the contamination of areas. Because, as far as the external radiation dose is concerned, the gamma rays are more significant biologically than the beta particles, the early fallout activity may be stated in gamma-megacuries, as a measure of the rate of emission of gamma-ray photons, where 1 gamma-megacurie represents the production of 3.7 × 10¹⁶ photons per second.
9.155 If an area is uniformly contaminated with any radioactive material of known activity (in gamma-mega curies) at a given time, it is possible to calculate the gamma-radiation dose rate at various heights above the surface, provided the average energy of the gamma-ray photons is known. The results of such calculations, assuming a contamination density of 1 gamma megacurie per square mile, for gamma rays having various energies, are represented in Fig. 9.155. If the actual contamination density differs from 1 megacurie per square mile, the ordinates in the figure would be multiplied in proportion.
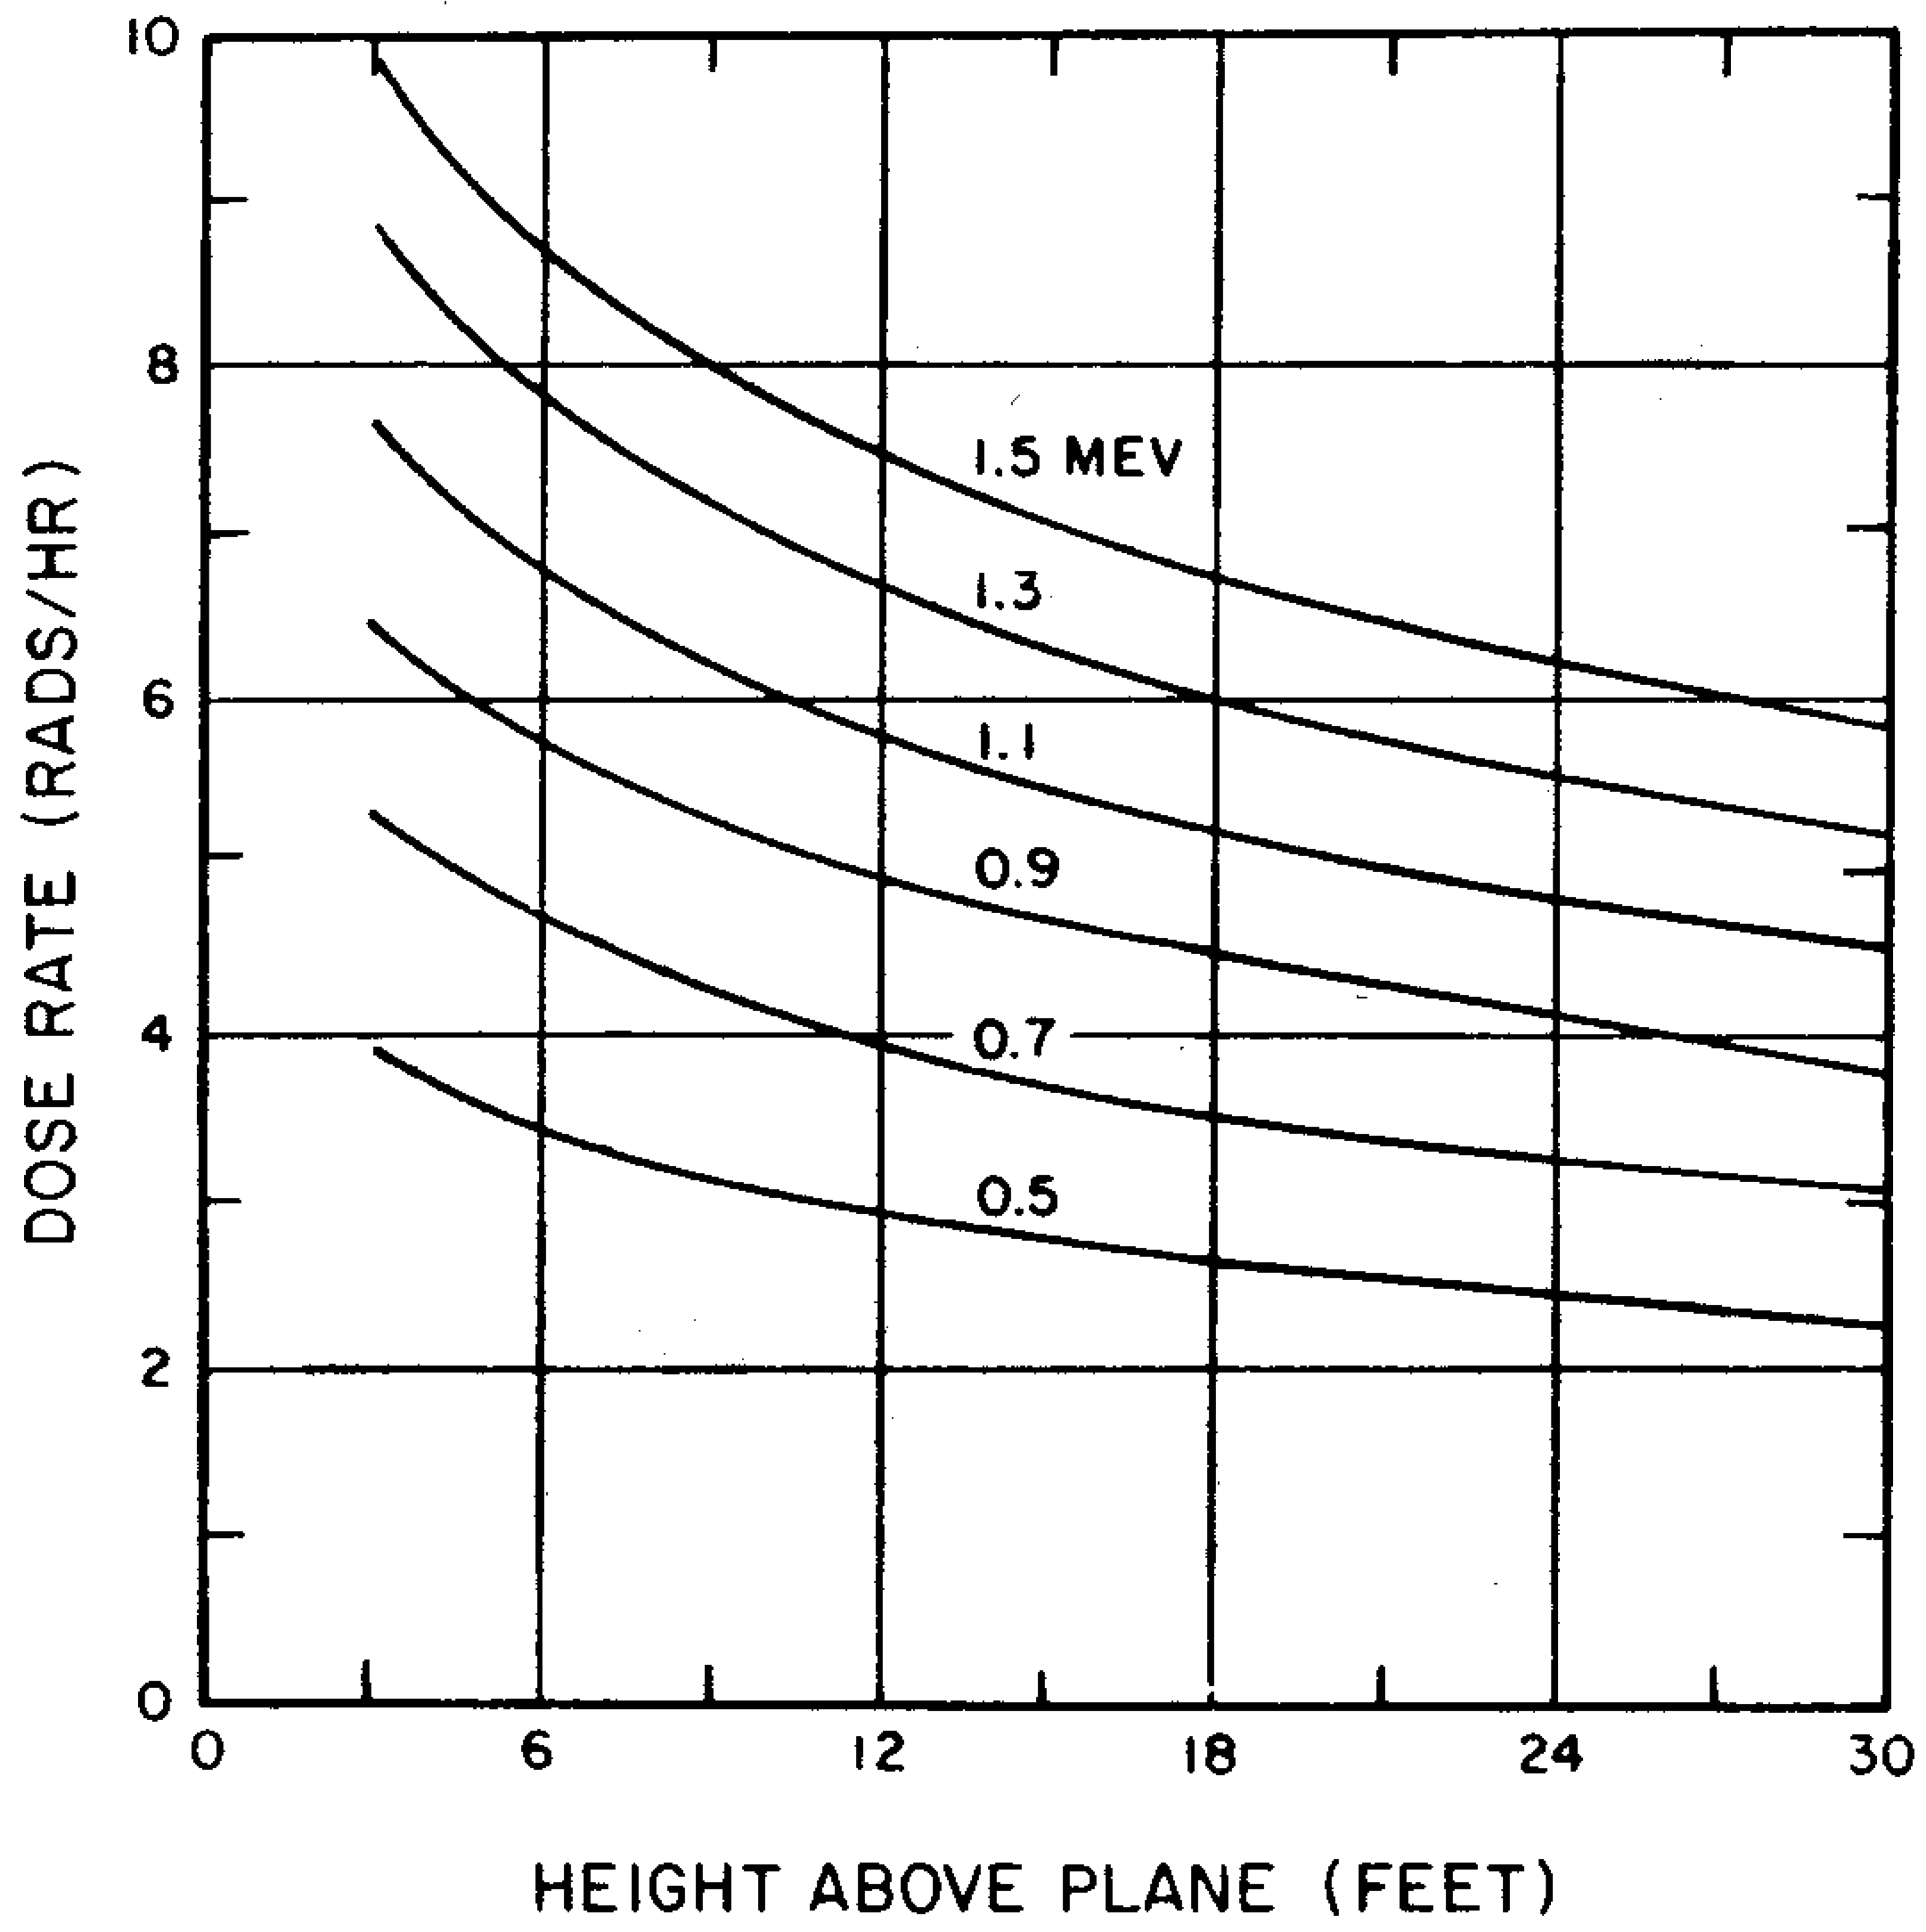
9.156 The calculations upon which Fig. 9.155 is based take into account the effects of buildup in air (§ 8.103). Furthermore, it is assumed that the surface over which the contamination is distributed is perfectly smooth and infinite in extent. For actual terrain, which is moderately rough and may have a variety of radiation shielding, the dose rate at a specific height above the ground would be less than for an infinite, smooth plane. The actual reduction factor will, of course, depend on the terrain features and the extent of the contaminated area. A terrain shielding factor of 0. 7 is commonly applied to the dose rates obtained from Fig. 9. 155 to obtain approximate average values for a moderately rough terrain (§ 9.95).
9.157 The dose rate at greater heights above the ground, such as might be observed in an aircraft, can be estimated with the aid of Fig. 9.157. The curve gives approximate values of the attenuation factor for early fallout radiation as a function of altitude. It applies in particular to a uniformly contaminated area that is large compared to the altitude of the aircraft. If the dose rate near, i.e., 3 feet above, the ground is known, then the value at any specified altitude can be obtained upon dividing by the attenuation factor for that altitude. On the other hand, if the dose rate is measured at a known altitude, multiplication by the attenuation factor gives the dose rate at about 3 feet above the ground at that time.
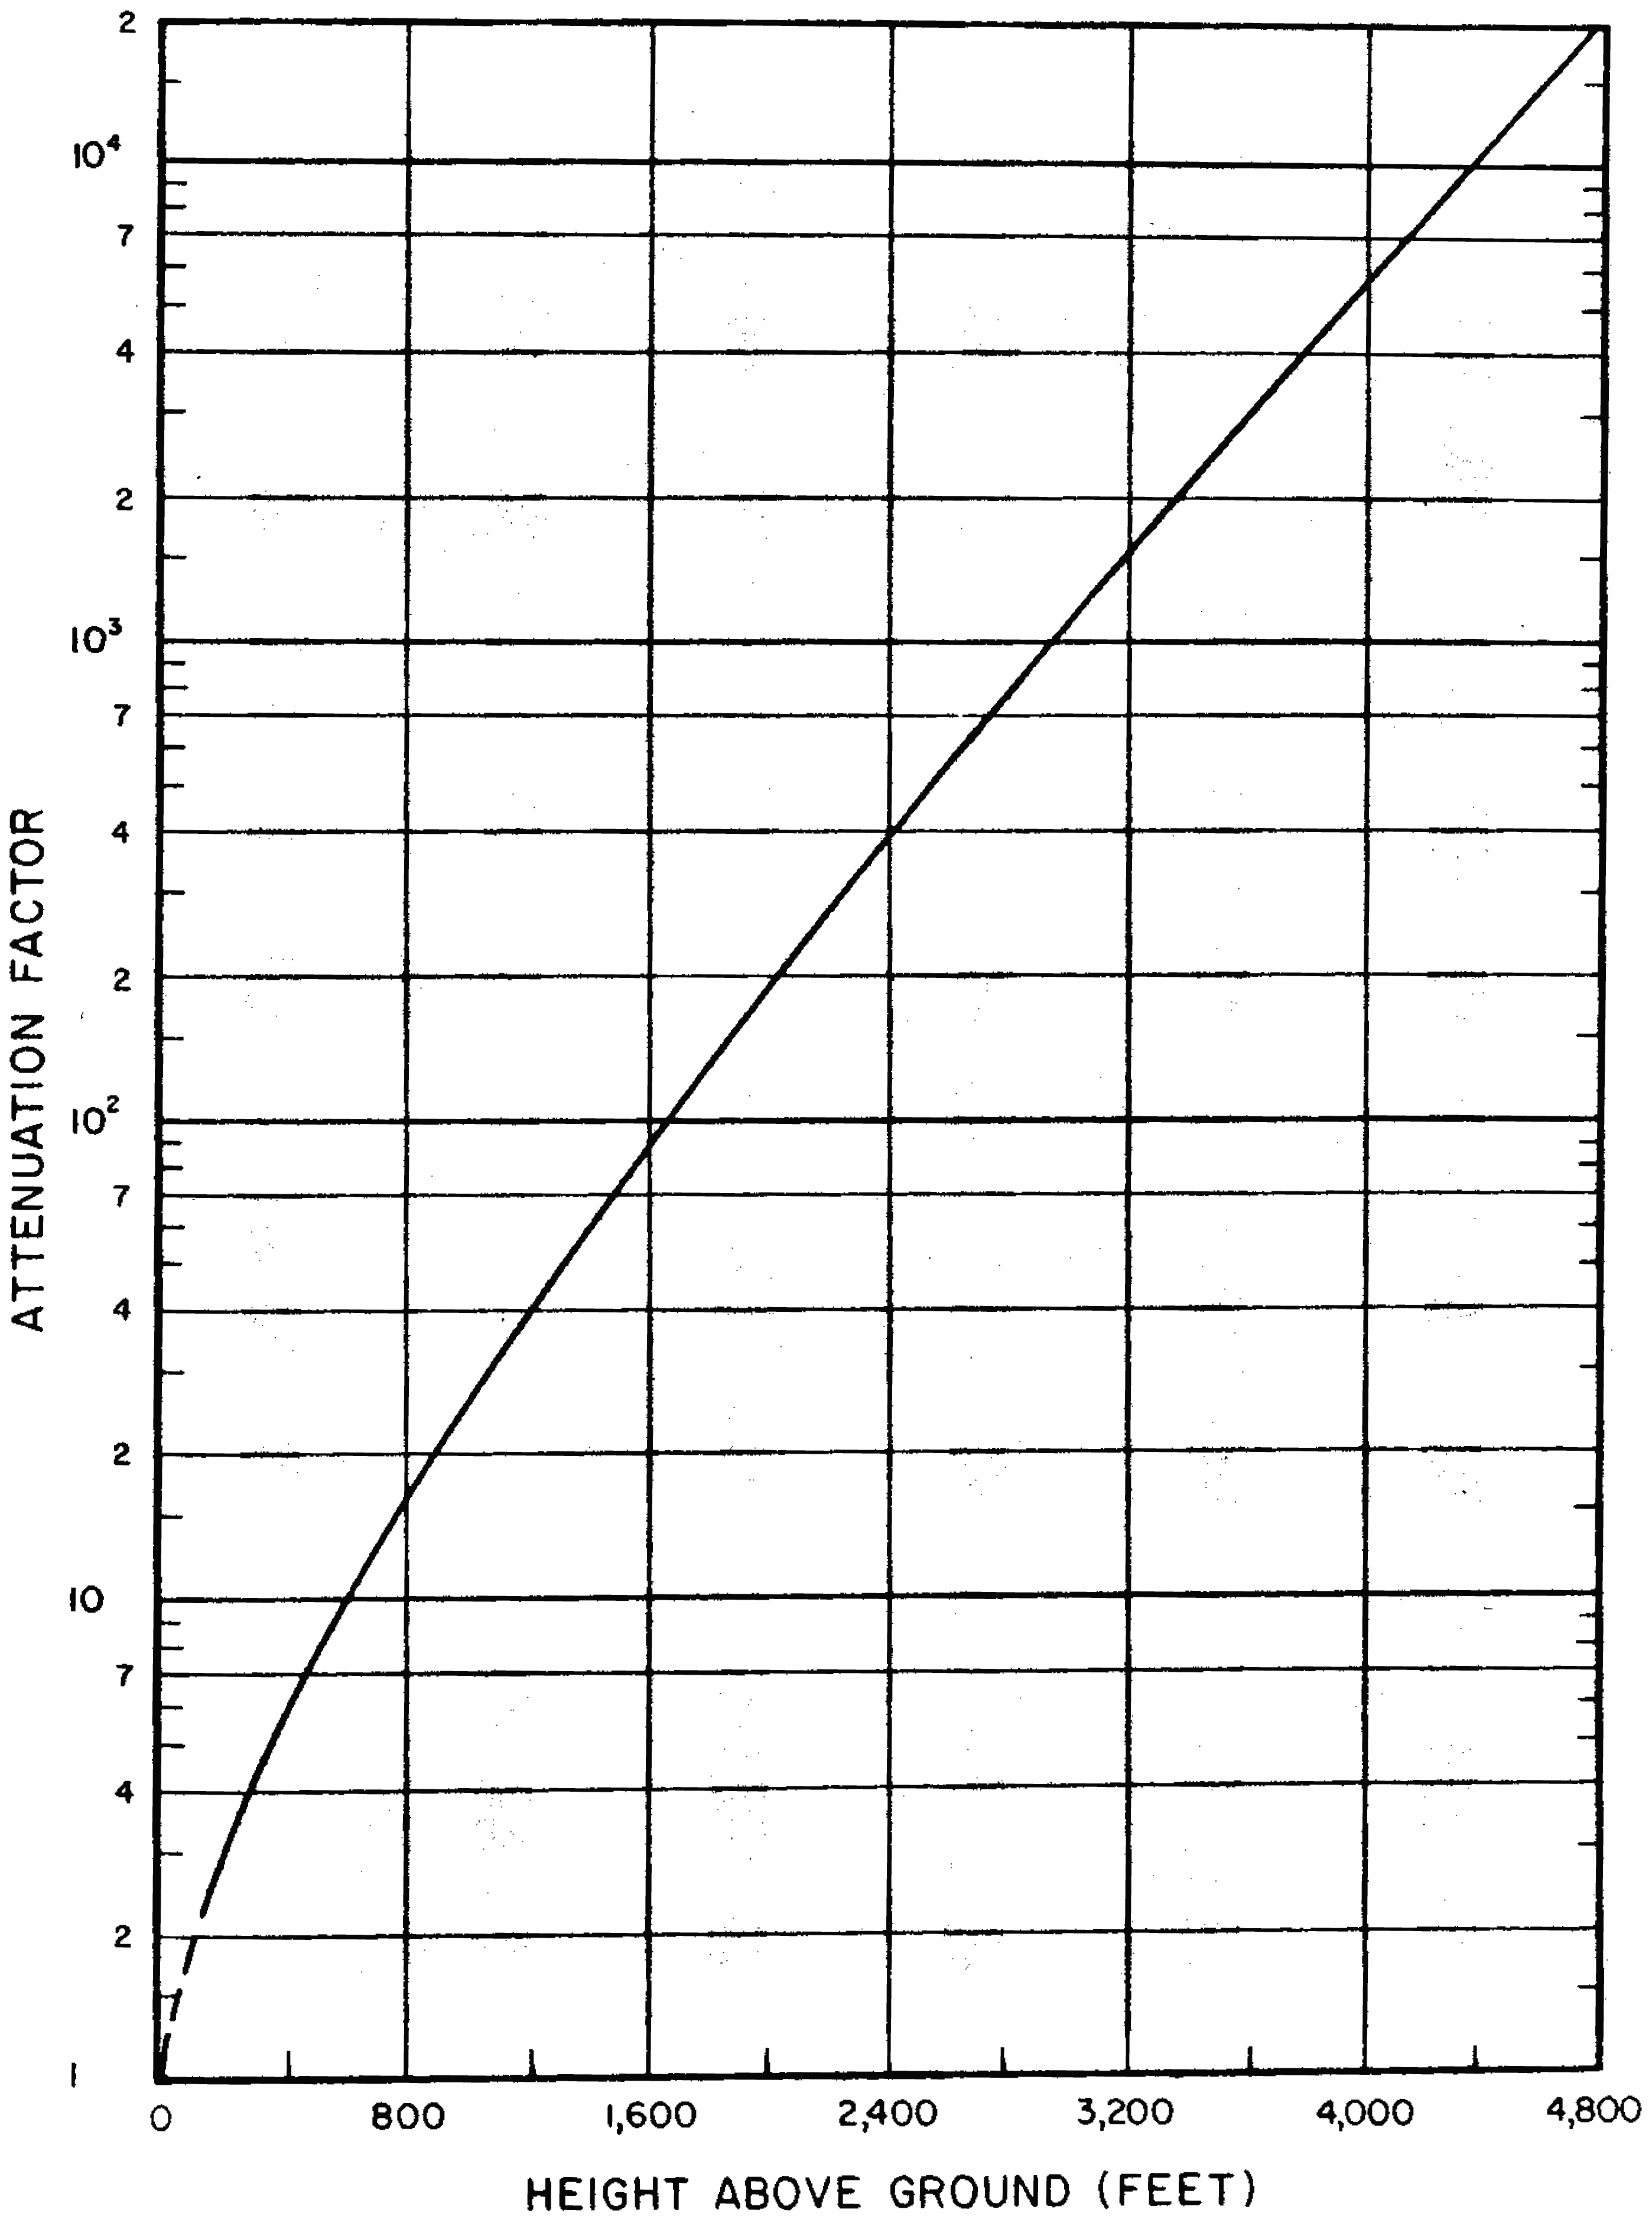
9.158 A possible use of the curve in Fig. 9. 157 is to determine the dose rate near the ground and contamination density from data obtained by means of an aerial survey. For example, suppose a radiation measuring instrument suspended from an aircraft at a height of 1,000 feet showed a radiation dose of 10. 24 rad/hr and that, from the known time after the explosion, the average energy of the gamma-ray photons was estimated to be 0.8 MeV. The attenuation factor for an altitude of 1,000 feet is approximately 27 and so the dose rate at 3 feet above ground at the time of the observation is roughly 10.24 × 27 = 6.5 rads/hr. It is seen from Fig. 9.155 that for a contamination density of 1 megacurie per square mile and a photon energy of 0.8 MeV, the dose rate 3 feet above the ground would be about 5.9 rads/hr. Hence, in the present case, the contamination density of the ground is approximately 6.515.9 = 1.1 gamma-megacurie per square mile.
9.159 The gamma-ray activity from the fission products will vary depending upon the nature of the fissionable material; however, it has been calculated that a reasonable average would be about 530 gamma-megacuries per kiloton fission yield at 1 hour after the explosion. The average photon energy also depends on the fissionable material, but at 1 hour after the explosion an average energy of about 0.7 MeV is a reasonable approximation. Thus, if all the (unfractionated) fission products from 1-kiloton fission yield were spread uniformly over a smooth plane 1 square mile in area, the radiation dose received at a point 3 feet above the plane can be estimated from Fig. 9.155 as 5.3 × 530 i.e., approximately 2,800 rads/hr. Activity induced by neutron capture in the weapon materials may add about 100 rads/hr to this figure, making a total of 2,900 rads/hr at 1 hour after the explosion. 12
9.160 If all of the radioactivity in the weapon debris were deposited uniformly over a smooth surface of area 1 square mile, the 1 hour dose rate above this area would thus be about 2,900 rads/hr per kiloton of fission yield. If the same residues were spread uniformly over a smooth surface of A square miles in area, the 1-hour dose rate would be 2,900 rads/hr; consequently, the product of the 1-hour dose rate and the area in square miles would be equal to 2,900 in units of (rads/hr) (miles)2/kt fission. If all the residues from 1-kiloton fission yield were deposited on a smooth surface in varying concentrations typical of an early fallout pattern, instead of uniformly, the product of the dose rate at 1 hour and the area would be replaced by the “area integral” of the 1-hour dose rate defined by
\[ \text{Area Integral } = \int_{\large{A}}^{\large{R_tdA}}, \]where $R_1$ is the 1-hour dose rate over an element of area $dA$ and $A$ square miles is the total area covered by the residues. Hence, regardless of the concentration pattern, the area integral of the 1-hour dose rate over a smooth surface would always be 2,900 (rads/hr) (miles)2/kt fission, assuming that the fallout had been completely deposited at that time.
9.161 Measurements after several nuclear tests have given a wide range of values, but a reasonable average is about 1,000 (rads/hr) (miles)2/kt fission. These measurements were made with radiation monitoring instruments at various times after the explosions. This value differs from the 2,900 (rads/hr) (miles)2/kt fission given above for two main reasons: first, only part of the radioactivity of the weapon residues appears in the early fallout, and second, corrections must be applied to the measured value for instrument response and terrain shielding. Typical ionization chamber monitoring instruments that were used in the surveys, calibrated in the usual manner, will read about 25 percent too low as a result of a nonlinear response to gamma rays of various energies, directional response, and shielding provided by the operator. This correction increases the “observed” area integral from 1,000 to about 1,300 (rads/hr) (miles)2/kt fission. If the terrain shielding factor is taken to be 0.7 (§ 9.156), the 1-hour dose rate area integral that would be measured over an ideal smooth plane, with no shielding, would be 1,300/0.7, i.e., approximately 1,900 (rads/hr) (miles)2/kt fission.
9.162 The ratio of 1,900 rads/hr to the theoretical 2,900 (rads/hr) (miles)2/kt fission indIcates that about 60 percent of the total gamma-ray activity of the weapon residues is deposited in the early fallout nom a land surface burst (§ 9.59). This value must be recognized as an estimate because the data upon which it is based are both limited and variable. For example, it depends to some extent on the nature of the surface material. Furthermore, as the burst height increases, the fraction of the weapon debris deposited as local fallout will decrease until the fireball no longer intersects the earth’s surface.
RATE OF PARTICLE FALL
9.163 The time at which particles of a given size and density will arrive at the ground from specified heights in the nuclear cloud may be calculated from aerodynamic equations of motion. The effects of vertical air motions are generally ignored since they cannot be predicted, especially as they are believed to be generally small for particles which fall within 24 hours. However, field test data sometimes indicate times of arrival which are quite different from those predicted by the theoretical calculations; hence, it is probable that vertical wind components and other factors may sometimes significantly influence the particle fall. One such factor is precipitation (§ 9.67 et seq.), but this will be disregarded here.
9.164 Some typical results of time of fall calculations are shown in Fig. 9. 164. The curves give the times required for particles of different sizes to fall to earth from various initial altitudes. The density of the fallout material is taken to be 2.5 g/cm3 which is roughly that of dry sand; the falling particles are assumed to be spherical, their radii being given in micrometers (µm). Actual fallout particles are sometimes quite irregular and angular in shape, although a large percentage tend to be fairly smooth and globular since they result from the solidification of fused spherical droplets of earth and of weapon debris (see Figs. 9.50a through d). Even if the particles are irregular, they can be assigned an effective radius and then treated as spheres for calculating times of fall.
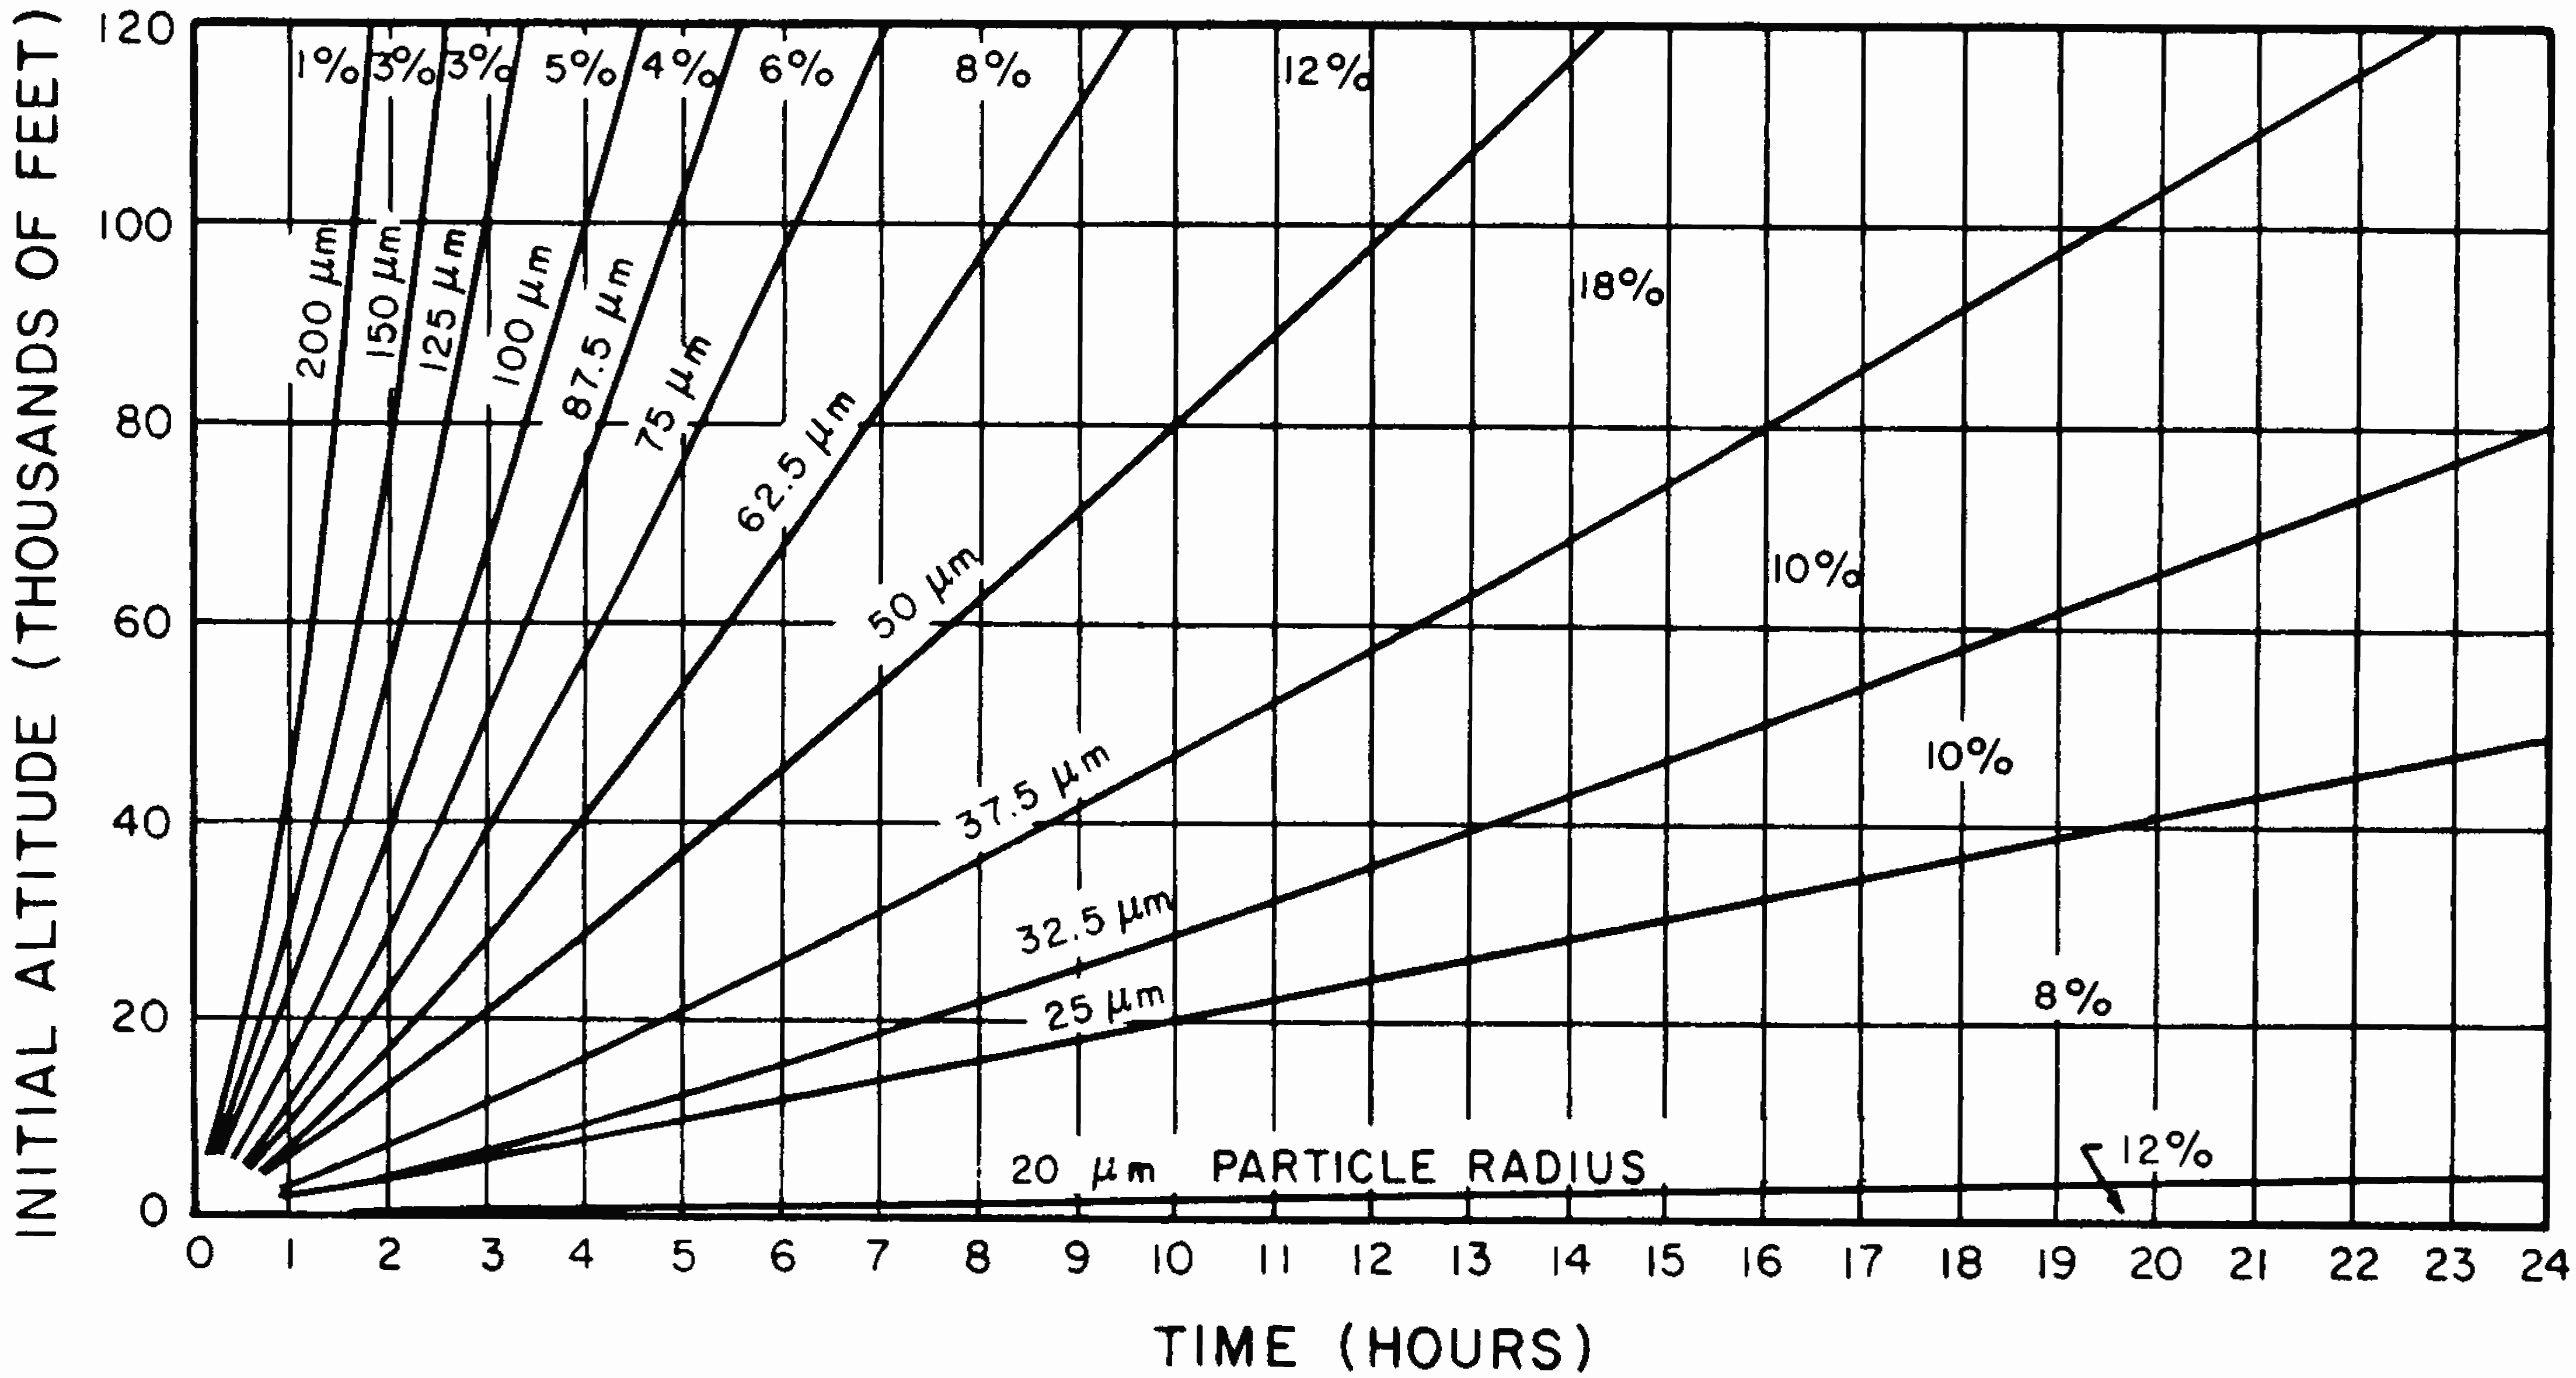
9.165 The percentages given in Fig. 9.164 represents estimates of the proportions of the total activity deposited by particles with sizes lying between pairs of lines. Thus, particles with radii larger than 200 µm carry 1 percent of the activity; those between 150 and 200 µm carry 3 percent, and so on; at the other extreme, particles less than 20 µm in radius carry 12 percent of the activity. This distribution of activity is known as “log-normal” because it obeys the normal (Gaussian) distribution law with the logarithm of the particle radius as the variable. It may not be strictly valid in any given case, since the activity distribution varies with the type of burst, the nature of the terrain at ground zero, etc. Nevertheless, it is characteristic of the activity distributions assumed for the theoretical analysis of fallout.
9.166 The method for estimating the arrival time of the fallout at a downwind location was described in § 9.91. Suppose that the time of arrival is 20 hours at a downwind distance of 300 miles from the explosion. If the nuclear cloud stabilizes at 60,000 feet, then it follows from Fig. 9.164 that, at this time, all particles with radii less than about 30 µ. will still be present, and that they carry roughly 28 percent of the total activity deposited in the early fall out. It is evident that, in spite of the decay which will have occurred in transit, fallout of appreciable activity may be expected 300 miles downwind at about 20 hours after the detonation.
BIBLIOGRAPHY
- , “Gamma-Ray Spectra of Fractionated Fission Products,” Naval Ordnance Laboratory, June 1971, NOLTR 71–103.
- , “Fallout Radiation Protection Provided by Transportation Vehicles,” EG & G, Inc., Las Vegas, Nevada, October 1972, EGG–1183–1566.
- , “Precipitation Scavenging and 2BPUFF.” University of California, Lawrence Livermore Laboratory, December 1971, UOPKA 71–14.
- , “Fission Product Decay Chains: Schematics with Branching Fractions, Half-Lives, and Literature References,” U.S. Naval Radiological Defense Laboratory, June 1967, USNRDL–TR–67–111.
- , “Calculated Activities, Exposure Rates, and Gamma Spectra for Unfractionated Fission Products,” U.S. Naval Radiological Defense Laboratory, December 1965, USNRDL–TR–1009.
- , “Gamma-Emission Data for the Calculation of Exposure Rates from Nuclear Debris, Volume I, Fission Products,” U.S. Naval Radiological Defense Laboratory, June 1965, USNRDL TR–876.
- , “Physical and Radiochemical Properties and Fallout Particles,” U.S. Naval Radiological Defense Laboratory, June 1965, USNRDL–TR–899.
- "Department of Defense Land Fallout Prediction System," Defense Atomic Support Agency, Washington, D.C.; U.S. Army Nuclear Defense Laboratory; U.S. Naval Radiological Defense Laboratory; Technical Operations Research, Burlington, Massachusetts, 1966, DASA 1800–1 through 1800–VII.
- , “Gamma Spectra of Uranium-235 Fission Products at Various Times After Fission,” Armed Forces Special Weapons Project, Washington, D.C., March 1959, AFSWP 524.
- , “Calculation of Abundances and Activities of the Products of High-Energy Neutron Fission of Uranium-238,” Defense Atomic Support Agency, Washington, D.C., May 1959, DASA 525.
- , “Gamma Spectra of Uranium-238 Fission Products at Various Times After Fission,” Defense Atomic Support Agency, Washington, D.C., May 1959, DASA 526.
- , Coordinators, “Precipitation Scavenging (1970),” AEC Symposium Series No. 22, U.S. Atomic Energy Commission, December 1970.
- , et al., “Final Report on Project Stardust, Volumes I through III,” Isotopes, A Teledyne Company, Westwood, New Jersey, October 1967, DASA 2166–1 through 2166–3.
- , “Distribution of Radioactivity with Height in Nuclear Clouds,” Proceedings of the Second Conference sponsored by the Fallout Studies Branch, U.S. Atomic Energy Commission, November 1965.
- , “Nature of Nuclear Debris in Sea Water,” Nature, 195, 1283 (1962).
- , “Potential Exposures from Low Yield Free Air Bursts,” University of California, Lawrence Livermore Laboratory, December 1971, UCRL–51164.
- , “HASL Model of Atmospheric Transport,” Health and Safety Laboratory, U.S. Atomic Energy Commission, New York, N.Y., September 1969, HASL–215.
- , “Comparison of Atmospheric Transport Model Calculations with Observations of Radioactive Debris,” J. Geophys. Res., 15, 2901 (1970).
- , “Updating Stratospheric Inventories to April 1974,” Fallout Program Quarterly Summary Report, Health and Safety Laboratory, U.S. Energy Research and Development Administration, New York, N.Y., July 1975, HASL–294.
- , “SEER II: A New Damage Assessment Fallout Model,” Stanford Research Institute, Menlo Park, California, May 1972, DNA 3008F.
- , “The Importance of Tritium in the Civil Defense Context,” University of California, Lawrence Livermore Laboratory. March 1971, UCRL–73085.
- National Academy of Sciences, Advisory Committee on Civil Defense, Subcommittee on Fallout, “Response to DCPA Questions on Fallout,” Defense Civil Preparedness Agency. Research Report No. 19, May 1973.
- , “An Empirical Model for Estimating World-Wide Deposition from Atmospheric Nuclear Detonations,” Health Physics, 18, 357 (1970).
- , “Aerosol Particle Size Dependence of the Rainout Rate,” Battelle Pacific Northwest Laboratories, AEC Research and Development Report, June 1971, BNWL–1551 Vol. II, Part I.
- , “United States Rainout and Hydrologic Implication,” Water Resources Research, 4, 273 (1968).
- *"Sr-90 and Sr-89 in Monthly Deposition at World Land Sites," Fallout Program Quarterly Summary Report, Appendix A, Health and Safety Laboratory, U.S. Atomic Energy Commission, New York, N.Y., April 1973, HASL–273 Appendix.
- , “Strontium-90 Deposition in New York City,” Science, 156, 1487 (1967).
- , “Worldwide Deposition of 90Sr Through 1974,” Fallout Program Quarterly Summary Report, Health and Safety Laboratory, U.S. Energy Research and Development Administration, New York, N.Y., October 1975, HASL–297.
*These documents may be purchased from the National Technical Information Service, Department of Commerce, Springfield, Virginia, 22161.
ENDNOTES
- 1 The actual value depends on the nature of the fissionable material and other weapon variables, but the number quoted here is a reasonable average (§ 9.159). [ref. § 9.14] X
- 2 Fallout radiation measurements (and calculations) have commonly been made in terms of gamma-ray exposures (or rates) in roentgens. For consistency with other chapters, however, all data in this chapter are given as the equivalent doses (or rates) in rads absorbed in tissue near the surface of the body (cf. § 8.18). The qualification “in tissue” will be omitted subsequently since it applies throughout the chapter. [ref. § 9.14] X
- 3 The significance of the dashed lines, marked “$t^{-1.2}$” will be described in § 9.146 et seq., where the physical meaning of the unit-time reference dose rate will be explained. For the present, the dashed lines may be ignored. [ref. § 9.16] X
- 4 Devices, similar to a slide rule, are available for making rapid calculations of the decay of fallout dose rates and related matters. [ref. § 9.19] X
- 5 In each act of decay of sodium-24, there are produced two gamma-ray photons, with energies of 1.4 and 2.8 MeV, respectively. The mean energy per photon from fission products at 1 hour after formation is about 1 MeV. [ref. § 9.35] X
- 6 The technique of washdown of ships, by continuous flow of water over exposed surfaces to remove fallout as it settles, was developed as a result of the Bikini BAKER observations. [ref. § 9.56] X
- 7 The Eniwetok Proving Grounds, called the Pacific Proving Ground before 1955, included test sites on Bikini and Eniwetok Atolls and on Johnston and Christmas Islands in the Pacific Ocean. [ref. § 9.75] X
- 8 An alpha particle is identical with a nucleus of the element helium (§ 1.65). When it has lost most of its (kinetic) energy, it captures two electrons and becomes a harmless (neutral) helium atom. [ref. § 9.114] X
- 9 One megaton of fission yield produces about 0.11 megacurie of strontium-90. [ref. § 9.141] X
- 10 The remaining sections of this chapter may be omitted without loss of continuity. [ref. Section 6] X
- 11 Physically the unit-time reference dose rate is the dose rate that would be received from the given (constant) amount of fallout at unit time, e.g., 1 hour after the explosion, although this quantity might actually be in transit at that time and would not have reached the location under consideration. [ref. § 9.147] X
- 12 The best values reported in the technical literature range from roughly 2,700 to 3,100 rads/hr for different fissionable materials and neutron energy spectra. The dose rate given here is considered to be a good average. [ref. § 9.159] X